


The Big Picture |

- “Suicide Prices” (& the Coming Crisis) at Big Law Firms
- Investors Need to Beware of Layers of Expenses
- Seven Varieties of Deflation
- Notes from The Big Picture Conference
- 10 Weekend Reads
- Gorgeous! New Aston Martin Vanquish
- The Big Interview: World Bank President Jim Yong Kim
- Where Would the Federal Funds Rate Be, If It Could Be Negative?
| “Suicide Prices” (& the Coming Crisis) at Big Law Firms Posted: 13 Oct 2012 03:00 PM PDT An increasing number of major law firms are quoting “suicide prices” just to get business that will keep their lawyers occupied, even though the firms can’t make money on the work, according to law firm consultant Bruce MacEwen. Those firms may be training clients, like department stores have done with their customers, only to buy when prices are discounted, which could lead to more major firms going out of business, says MacEwen, who writes at Adam Smith, Esq. (http://www.adamsmithesq.com) MacEwen talks with Bloomberg Law’s Lee Pacchia.
There are simply too many partners and associates at many firms. Adding to the firms’ economic challenges, the revenues of legal process outsourcers (LPOs) are expected to grow 85 percent in the next few years. The result is more attorney layoffs are likely ahead, he says. Big firms have “avoided the really difficult, awkward conversations” about trimming partner ranks. But “that day is coming, because that’s where the money is,” he says. “Most partners actually don’t understand the firm’s business. It’s not their job. They want to serve their clients. That’s why they made partner. But it presents a tremendous challenge to managing partners” in a time of economic challenges, MacEwen says. Twenty-five years ago, average partner pay at the AmLaw 100 law firms was 11 percent higher than that of the average American worker. Today it is 23 times higher. “You cannot grow that tree to the sky forever,” says MacEwen. “Some firms get it completely; other firms just are hoping they can hold their breath and it will be 2006 again.” |
| Investors Need to Beware of Layers of Expenses Posted: 13 Oct 2012 01:30 PM PDT Nice illustration of fee buildup: <
The full article is worth reading . . .
|
| Posted: 13 Oct 2012 12:15 PM PDT A Little Chronic Deflation
One of the questions I (and other analysts) get asked most frequently is whether I think there is deflation or inflation in store for the US. My quick answer is “Yes.” A brief answer is that we are in a deflationary period and have been for over 30 years, but like all cycles it will come to an end. A great deal of the “when” depends on how the US deals with its deficit following the election. If we put the US on a realistic glide path to a balanced budget (over time) then that deflationary impulse will last longer than most observers think, even given QE3+++. If we do not deal with the issue, and try once again to kick the can to the next election, inflation could be a very real problem. But one of the definitive experts on the question, and someone who has taught me a great deal over the years, is Dr. Gary Shilling, who has literally written the book (several, actually) on deflation. This week he summarizes a recent client letter for our Outside the Box, and I think you’ll will find stimulating. His is not the consensus view, but it’s one we need to understand. You can subscribe to Gary Shilling’s Insight for the special introductory rate of $275 for Outside the Box readers (email delivery) and get a copy of the full Insight report excerpted here plus a copy of Gary’s latest book, Letting Off Steam, a collection of his commentaries on matters great and small, complex and mundane, serious and frivolous. Gary will be writing about the details of who will be winners and losers in the Fed’s QE3 program, how overseas economies are faring, and what it all means for US stocks and the American economy. To subscribe to Insight call them at 888-346-7444 or 973-467-0070 and be sure to mention you read about the offer here. This has been an interesting week. I was supposed to speak at a client meeting for Common Sense Investments at noon on Wednesday in Portland. Kyle Bass of Hayman Advisors was also speaking, so he graciously offered to let me fly with him in his plane rather than catching a redeye the night before. I got up early and made it to the hangar, but the plane had a mechanical problem. A quick call to American Airlines and a mad dash to the airport got me on a scheduled flight that would have gotten me in on time. Except that flight too had issues and the other flights were booked solid. An extremely helpful staff member at American somehow sorted it out and got me onto a full flight (with wifi!) and into Portland in time to let me give a speech as the “closer” for the day. Meanwhile, Kyle was in Chicago and found another way to get to Portland. The other speaker had a personal tragedy to deal with and couldn’t make it; so I called my old friend Ed Easterling, who lives not far from Portland, and he kicked the meeting off with his usual dynamic presentation while the rest of us figured out how to get there. The next day, the founder of Common Sense Investments, Jim Bisenius, took us to his 36,000 acre ranch (and wildlife preserve) in Eastern Oregon to do a little hunting and fishing. It is a rather amazing place. He is such a gracious host and has a gift for getting people to tell their stories. Kyle brought along a young man who had been Special Operations in Iraq and who now carries around about four pounds of metal from a IED that can’t be gotten out of him. He’s in quite a lot of chronic pain but is rather cheerful and can tell some pretty amazing stories. It makes me humble to realize what sacrifices people make for our freedoms. The courage he and his brethren display on a regular basis is inspiring. I simply stand in awe and gratitude. I was able to hitch a ride back to Dallas, got in late, got up the next morning, taped videos and read some emails, and then hopped another plane to Houston, where I am getting ready to go to my 40th Rice University class reunion. I am sure it will be another night of old friends and great stories, so I think I will hit the send button and go on to the party. Have a great week! Your rather amazed at how much fun I get to have analyst, (Even more amazing is that I get paid for this!) John Mauldin, Editor
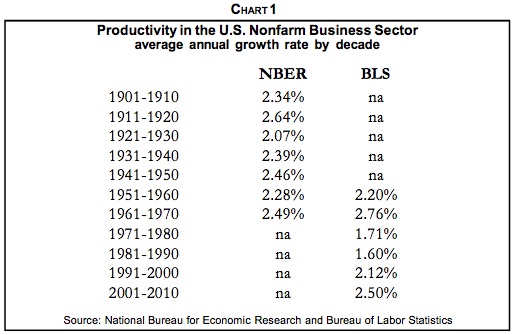
subscribers@mauldineconomics.com Seven Varieties of DeflationBy Dr. A. Gary Shilling Inflation in the U.S. has historically been a wartime phenomenon, including not only shooting wars but also the Cold War and the War on Poverty. That’s when the federal government vastly overspends its income on top of a robust private economy—obviously not the case today when government stimulus isn’t even offsetting private sector weakness. Deflation reigns in peacetime, and I think it is again, with the end of the Iraq engagement and as the unwinding of Afghanistan expenditures further reduce military spending. Chronic DeflationFew agree with my forecast of chronic deflation. They’ve never seen anything but inflation in their business careers or lifetimes, so they think that’s the way God made the world. Few can remember much about the 1930s, the last time deflation reigned. Furthermore, we all tend to have inflation biases. When we pay higher prices, it’s because of the inflation devil himself, but lower prices are a result of our smart shopping and bargaining skills. Furthermore, we don’t calculate the quality-adjusted price declines that result from technological improvements in many big-ticket purchases. This is especially true since many of those items, like TVs, are bought so infrequently that we have no idea what we paid for the last one. But we sure remember the cost of gasoline on the last fill-up a week ago. DoubtsFurthermore, many believe widespread deflation is impossible and that rampant inflation is assured in future years because of continuing high federal deficits, regardless of any long-run budget reform. And annual deficits of over $1 trillion are likely to persist in the remaining five to seven years of deleveraging, as I explain in my recent book, The Age of Deleveraging. The 2% annual real GDP growth I see persisting is well below the 3.3% needed to keep the unemployment rate stable. So to prevent high and chronically rising unemployment, any Administration and Congress—left, right or center—will be forced to spend a lot of money to create a lot of jobs. But big federal deficits are inflationary only when they come on top of fully-employed economies and create excess demand. That’s obviously not true at present when large deficits are reactions to private sector weakness that has slashed tax revenues and encouraged deficit spending. Indeed, the slack in the economy in the face of persistent trillion dollar-plus deficits measures the huge size and scope of the offsetting deleveraging in the private sector, as noted earlier. The deleveraging, especially in the global financial sector and among U.S. consumers, will be completed in another five to seven years at the rate it is progressing. At that point, the federal deficit should fade quickly, assuming a war or other cause of oversized government spending doesn’t intervene. The resumption of meaningful economic growth will reduce the pressure for economic stimuli and rising incomes and corporate profits will spur revenues. Serious work on the postwar baby-related bulge in Social Security and Medicare costs will also depress the deficit. Good DeflationA decade ago in my two Deflation books, I distinguished between two types of deflation—the Good Deflation of excess supply and the Bad Deflation of deficient demand. Good Deflation is the result of important new technologies that spike productivity and output even as the economy grows rapidly. Bad Deflation results from financial crises and deep recession, which hype unemployment and depress demand. I’ve been forecasting chronic good deflation of excess supply because of today’s convergence of many significant productivity-soaked technologies such as semiconductors, computers, the Internet, telecom and biotech that should hype output. Ditto for the globalization of production and the other deflationary forces I’ve been discussing since I wrote the two Deflation books and The Age of Deleveraging. As a result of rapid productivity growth, fewer and fewer man-hours are needed to produce goods and services. The rapid productivity growth so far this decade is likely to persist (Chart 1).
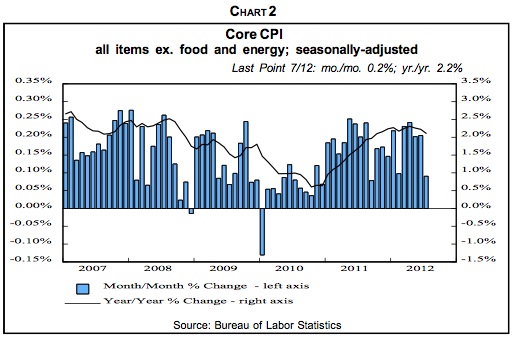
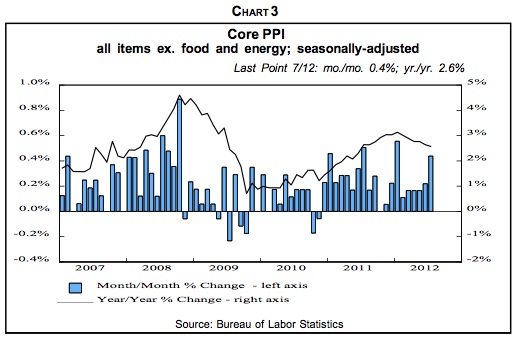
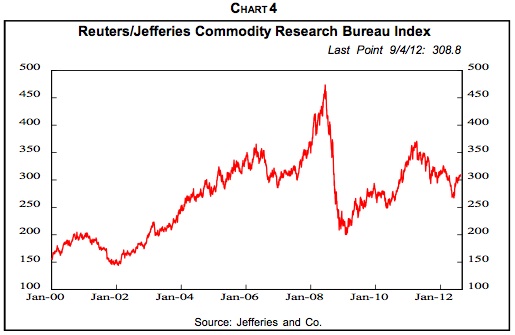
While I’ve consistently predicted the good deflation of excess supply, I said clearly that the bad deflation of deficient demand could occur—due to severe and widespread financial crises or due to global protectionism. Both are now clear threats. My forecast is that the unfolding global slump will initiate worldwide chronic deflation. A number of indicators point in that direction. Sure, much of the recent weakness in the PPI and CPI has been due to falling energy and food prices. Excluding these volatile items, prices are still rising but at slowing rates (Charts 2 and 3). Consumer price inflation is also falling abroad in the U.K. and the eurozone.
After China’s huge stimulus program in 2009 in response to the global recession and nosedive in exports to U.S. consumers, the economy revived, but so did inflation. Double-digit food price jumps were especially troublesome in a land where many live at subsistence levels. So in response to the surge in inflation and the real estate bubble, Chinese leaders tightened economic policy, driving down CPI inflation to a 2.0% rise in August vs. a year earlier. But, in conjunction with the weakening in export growth, that is pushing China toward a hard landing of 5% to 6% economic growth, well below the 7% to 8% needed to maintain stability. Back in the States, inflationary expectations, as measured by the spread between 10-year Treasury yields and the yield on comparable Treasury Inflation-Protected Securities are narrowing. Other VarietiesBesides rises or falls in general price levels, which most think about when they hear “inflation” or “deflation,” there are six other varieties, maybe more. Commodity Inflation/Deflation. In the late 1960s, the mushrooming costs of the Vietnam War and the Great Society programs in an already-robust economy created a tremendous gap between supply and demand in many areas. The history of low inflation rates for goods and services, we’ll call it CPI inflation for short, in the late 1950s and early 1960s, apparently created a momentum of low price advances that kept CPI inflation from exploding until about 1973. But by the early 1970s, commodity prices started to leap and spawned a self-feeding up surge. Worried that they’d run out of critical materials in a robust economy, producers started to double and triple order supplies to insure adequate inventories. That hyped demand, which squeezed supply, and prices spiked further. That spawned even more frenzied buying as many expected shortages to last forever. At the time, even before the 1973 oil embargo, I was lucky enough to realize that what was occurring was not perennial shortages but massive inventory-building. I found a parallel in post-World War I when wartime price and wage controls were removed and wholesale prices skyrocketed about 30% in one year as double and triple ordering hyped inventories amid frenzied demand and fears of shortages. Then all those inventories arrived and sired the 1920-1921 recession, the sharpest on record, and wholesale prices collapsed. Armed with this history, I correctly forecast the 1973-1975 recession and said it would be the worst since the 1930s, which it proved to be. Arriving inventories swamped production, especially in late 1974 and early 1975, so production nosedived. Another Commodity BubbleIt’s probably no coincidence that China’s joining the World Trade Organization at the end of 2001 was followed by the commencement of another global commodity price bubble that started in early 2002 (Chart 4). And it has been a bubble, in my judgment, based on the conviction that China would continue to absorb huge shares of the world’s industrial and agricultural commodities. The shift of global manufacturing toward China magnified her commodity usage as, for example, iron ore that previously was processed into steel in the U.S. or Europe was sent to China instead.
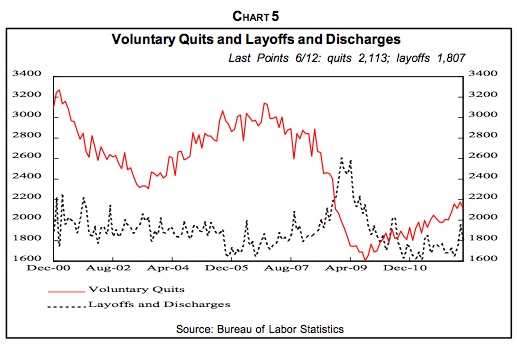
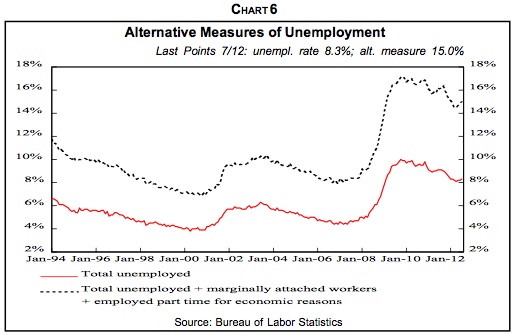
Peak OilCrude oil has been the darling of the commodity-shortage crowd, and when its price rose to $145 per barrel in July 2008, many became convinced that the world would soon run out of oil. But they discounted the fact that reserves are often underestimated since oil fields produce more than original conservative estimates. Nor did they expect conventional and shale natural gas, liquefied natural gas, the oil sands in Canada, heavy oil in Venezuela and elsewhere, oil shale, coal, hydroelectric power, nuclear energy, wind, geothermic, solar, tidal, ethanol and biomass energy, fuel cells, etc. to substitute significantly for petroleum. Recent WeaknessThe weakness in commodity prices, starting in early 2011, no doubt has been anticipating both a hard landing in China and a global recession. In my view, the foundation of the decade-long commodity bubble is crumbling, and the unfolding of a hard landing in China and worldwide recession will depress commodity prices considerably, even from current levels, as disillusionment replaces investor enthusiasm. Wage-Price Inflation/Deflation. A second variety of inflation is a particularly virulent form, wage-price inflation in which wages push up prices, which then push up wages in a self-reinforcing cycle that can get deeply and stubbornly embedded in the economy. This, too, was suffered in the 1970s and accompanied slow growth. Hence the name, stagflation. As with commodity inflation, it was spawned by excess aggregate demand resulting from huge spending and the Vietnam War and Great Society programs on top of a robust economy. Back then, labor unions had considerable bargaining strength and membership. Furthermore, American business was relatively paternalist, with many business leaders convinced they had a moral duty to keep their employees at least abreast of inflation. Most didn’t realize that, as a result, inflation was very effectively transferring their profits to labor. And also to government, which taxed underdepreciation and inventory profits. The result was a collapse in corporate profits’ share of national income and a comparable rise in the share going to employee compensation from the mid-1960s until the early 1980s. The PeakThe wage-price spiral peaked in the early 1980s as CPI inflation began a downtrend that has continued. Voters rebelled against Washington, elected Ronald Reagan and initiated an era of government retrenchment. The percentage of Americans who depend in a significant way on income from government rose from 28.7% in 1950 to 61.2% in 1980, but then fell to 53.7% in 2000. Furthermore, the Fed, under then-Chairman Paul Volcker, blasted up interest rates, and negative real borrowing costs turned to very high positive levels. As inflation receded, American business found itself naked as the proverbial jaybird with depressed profits and intense foreign competition. In response, corporate leaders turned to restructuring with a will. That included the end of paternalism towards employees as executives realized they were in a globalized atmosphere of excess supply of almost everything. With operations and jobs moving to cheaper locations offshore and with the economy increasingly high tech and service oriented, union membership and power plummeted, especially in the private sector. In today’s unfolding deflation, the wage-price spiral has been reversed. Contrary to most forecaster expectations, but forecast in my two Deflation books, wages are actually being cut and involuntary furloughs instituted for the first time since the 1930s. In inflation, oversized wages can be cut to size by simply avoiding pay hikes while inflation erodes real compensation to the proper level. But with deflation, actual cuts in nominal pay are necessary. Note that as wage cuts and furloughs become increasingly prevalent, the layoff (Chart 5) and unemployment numbers (Chart 6) will increasingly understate the reality of the declines in labor compensation.
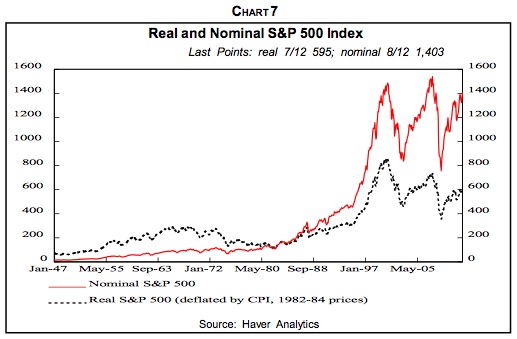
Financial Asset Inflation/Deflation. Perhaps the best recent example of financial asset inflation was the dot com blowoff in the late 1990s. It culminated the long secular bull market that started in 1982 and was driven by the convergence of a number of stimulative factors. CPI inflation peaked in 1980 and declined throughout the 1980s and 1990s. That pushed down interest rates and pushed up P/Es. American business restructured and productivity leaped. A Secular Down CycleThe robust economy upswing that drove the 1982-2000 secular bull market ended in 2000, as shown by basic measures of the economy’s health. Stocks, which gauge economic health as well as fundamental sentiment, have been trending down since 2000 in real terms (Chart 7). At the rate that deleveraging worldwide is progressing, it will take another five to seven years to be completed with equity prices continuing weak on balance during that time. Employment also peaked out in 2000 even after accounting for lower although rising labor participation rates by older Americans. Household net worth in relation to disposable (after-tax) income has also been weak for a decade.
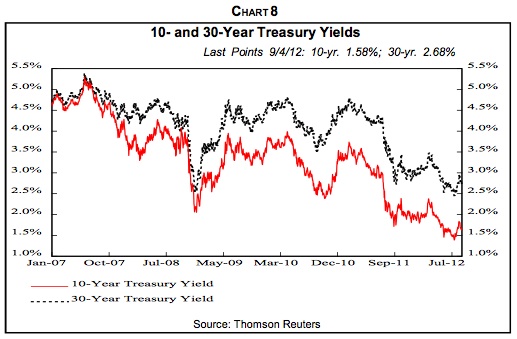
The Federal Reserve’s Survey of Consumer Finances, just published for 2007-2010, reveals that median net worth of families fell 39% in those years from $126,400 to $77,300, largely due to the collapse in house prices. Average household income fell 11% from $88,300 to $78,500 in those years with the middle-class hit the hardest. The top 10% by net worth had a 1.4% drop in median income, the lowest quartile lost 3.7% but the second quartile was down 12.1% and the third quartile dropped 7.7%. Households reacted to too much debt by reducing it. In 2010, 75% of households had some debt, down from 77% in 2007, according to the Fed survey. Those with credit card balances fell from 46.1% to 39.4% but late debt payments were reported by 10.8% of households, up from 7.1% in 2007. With house prices collapsing, debt as a percentage of assets climbed to 16.4% in 2010 from 14.8% in 2007. Financial strains reduced the percentage that saved in the preceding year from 56.4% in 2007 to 52% in 2010. Nevertheless, the gigantic policy ease in Washington in response to the stock market collapse and 9/11 gave the illusion that all was well and that the growth trend had resumed. The Fed rapidly cut its target rate from 6.5% to 1% and held it there for 12 months to provide more-than ample monetary stimulus. Meanwhile, federal tax rebates and repeated tax cuts generated oceans of fiscal stimulus as did spending on homeland security, Afghanistan and then Iraq. As a result, the speculative investment climate spawned by the dot com nonsense survived. It simply shifted from stocks to commodities, foreign currencies, emerging market equities and debt, hedge funds, private equity—and especially to housing. Homeownership additionally benefited from low mortgage rates, loose lending practices, securitization of mortgages, government programs to encourage home ownership and especially to the conviction that house prices would never fall. Investors still believed they deserved double-digit returns each and every year, and if stocks no longer did the job, other investment vehicles would. This prolongs what I have dubbed the Great Disconnect between the real world of goods and services and the speculative world of financial assets. TreasurysI hope you’ll recall my audacious forecast of 2.5% yields on 30-year Treasury bonds and 1.5% on 10-year Treasury notes, made at the end of last year when the 30-year yield was 3.0%. Those levels were actually reached recently (Chart 8), and I now believe the yields will fall to 2.0% and 1.0%, respectively, for the same reasons that inspired my earlier forecasts. The global recession will attract money to Treasurys as will deflation and their safe-haven status. Sure, Treasurys were downgraded by Standard & Poor’s last year, but in the global setting, they’re the best of a bad lot.
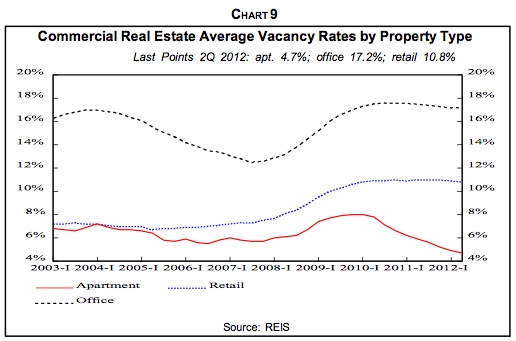
The deflation in interest rates has spawned significant side effects. It’s a zeal for yield that has pushed many individual and institutional investors further out on the risk spectrum than they may realize. Witness the rush into junk bonds and emerging country debt. Recently, investors have jumped into the government bonds of Eastern European countries such as Poland, Hungary and Turkey where yields are much higher than in developed lands. The yield on 10-year notes in Turkish lira is about 8% compared to 1.4% in Germany and 1.6% in the U.S. The inflows of foreign money has pushed up the value of those countries’ currencies, adding to foreign investor returns. And some of these economies look solid relative to the troubled eurozone—Poland avoided recession in the 2008-2009 global financial crisis. But the continuing eurozone financial woes and recession may well drag the zone’s Eastern European trading partners down. And then, as foreign investors flee and their central banks cut rates, their currencies will nosedive much as occurred in Brazil. Tangible Asset Inflation/Deflation. Booms and busts in tangible asset prices are a fourth form of inflation/deflation. The big inflation in commercial real estate in the early 1980s was spurred by very beneficial tax law changes earlier in the decade and by financial deregulation that allowed naïve savings and loans to make commercial real estate loans for the first time. But deflation set in during the decade due to overbuilding and the 1986 tax law constrictions. Bad loans mounted and the S&L industry, which had belatedly entered commercial real estate financing, went bust and had to be bailed out by taxpayers through the Resolution Trust Corp. Nonresidential structures, along with other real estate, were hard hit by the Great Recession and remain weak as capacity remains ample and prices of commercial real estate generally persist well below the 2007 peak. The two obvious exceptions are rental apartments and medical office buildings. Returns on property investments recovered from the 2007-2009 collapse, but are now slipping. Retail vacancy rates remain high (Chart 9) due to cautious consumers and growing online sales. Rents remain about flat. Ditto for office vacancies due to weak employment and the tendency of employers to move in the partitions to pack more people into smaller office spaces. The office vacancy rate in the second quarter was 17.2%, the same as the first quarter, down slightly from the post-financial crisis peak of 17.6% in the third quarter of 2010 but well above the 2007 boom level of 13.8%. In the second quarter, office space occupancy rose just 0.12% from the previous quarter compared to 0.18% in the first quarter.
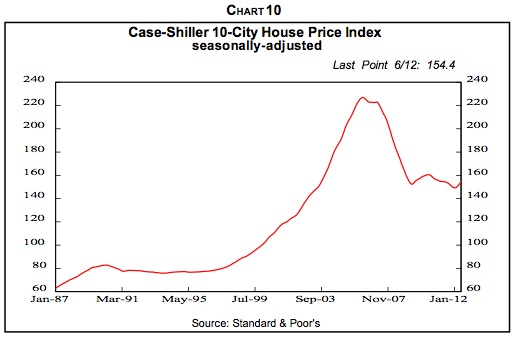
Housing WoesHouse prices have been deflating for six years, with more to go (Chart 10). The earlier housing boom was driven by ample loans and low interest rates, loose and almost non-existent lending standards, securitization of mortgages which passed seemingly creditworthy but in reality toxic assets on to often unsuspecting buyers, and most of all, by the conviction that house prices never decline.
I expect another 20% decline in single-family median house prices and, consequently, big problems in residential mortgages and related construction loans. In making the case for continuing housing weakness, I’ve persistently hammered home the ongoing negative effect of excess inventories on house sales, prices, new construction and just about every other aspect of residential real estate. Spreading EffectsThat further drop would have devastating effects. The average homeowner with a mortgage has already seen his equity drop from almost 50% in the early 1980s to 20.5% due to home equity withdrawal and falling prices. Another 20% price decline would push homeowner equity into single digits with few mortgagors having any appreciable equity left. It also would boost the percentage of mortgages that are under water, i.e., with mortgage principals that exceed the house’s value, from the current 24% to 40%, according to my calculations. The negative effects on consumer spending would be substantial. So would the negative effects on household net worth, which already, in relation to after-tax income, is lower than in the 1950s. Currency inflation/deflation. We all normally talk about currency devaluation or appreciation. This is, however, another type of inflation/deflation and like all the others, it has widespread ramifications. Relative currency values are influenced by differing monetary and fiscal policies, CPI inflation/deflation rates, interest rates, economic growth rates, import and export markets, safe haven attractiveness, capital and financial investment opportunities, attractiveness as trading currencies, and government interventions and jawboning, among other factors. In recent years, Japan, South Korea, China and Switzerland have all acted to keep their currencies from rising to support their exports and limit imports. The U.S. dollar has been strong of late, resulting from its safe haven status in the global financial crisis. Furthermore, the U.S. economy, while slipping, is in better shape than almost any other—the best of the bunch. I believe the global recession will persist and the greenback will continue to serve this role. Furthermore, the greenback is likely to remain strong against other currencies for years as it continues to be the primary international trading and reserve currency. The dollar should continue to meet at least five of my six criteria for being the dominant global currency: 1. After deleveraging is complete, the U.S. will return to rapid growth in the economy and in GDP per capita, driven by robust productivity. 2. The American economy is large and likely to remain the world’s biggest for decades. 3. The U.S. has deep and broad financial markets. 4. America has free and open financial markets and economy. 5. No likely substitute for the dollar on the global stage is in sight. 6. Credibility in the buck has been in decline since 1985, but may revive if long-run government deficits are addressed and consumer retrenchment and other factors shrink the foreign trade and current account deficits. Inflation By Fiat. Way back in 1977, I developed the Inflation by Fiat concept, which gained media attention in that era of high wage-price inflation. This seventh form of inflation encompassed all those ways by which, with the stroke of a pen, Congress, the Administration and regulators raise prices. The continual rises in the minimum wage is a case in point. So, too, are high tariffs on imported Chinese tires. Agricultural price supports keep prices above equilibrium. As a result, the producer price of sugar in the U.S. is 28 cents per pound compared to the 19 cents world price. Federal contractors are required to pay union wages, which almost always exceed nonunion pay, as noted earlier, another example of inflation by fiat. Environmental protection regulations may improve the climate, but they increase costs that tend to be passed on in higher prices. The Administration says its new fuel-economy standards of 54.5 miles per gallon by 2025 will cost $1,800 per vehicle but industry estimates put it at $3,000. The cap and trade proposal to reduce carbon emissions is estimated to cost each American household $1,600 per year, according to the Congressional Budget Office. Pay hikes for government workers must be paid in higher taxes sooner or later, and can spill over into private wage increases—although state and local government employee pay is moving back toward private levels, as discussed earlier. Increases in Social Security taxes raise employer costs, which they try to pass on in higher selling prices. There was some deflation by fiat in the 1980s and 1990s. One of the biggest changes was requiring welfare recipients to work or be in job-training programs. That reduced the welfare rolls from 4.7% of the population in 1980 to 2.1% in 2000, while the overall number that depended on government for meaningful income dropped from 61.2% to 53.7%. But now, as an angry nation and left-leaning Congress and Administration react to the financial collapse, Wall Street misdeeds and the worst recession since the Great Depression, the increases in government regulation and involvement in the economy have been substantial. And with them, more inflation by fiat—at least unless there is a major change of government control with the November elections. (Excerpted from Gary Shilling’s INSIGHT newsletter. For more information, visit www.agaryshilling.com) |
| Notes from The Big Picture Conference Posted: 13 Oct 2012 09:00 AM PDT David Laubach works at Scarsdale Equities, and is usually in attendance at their weekly Ideas/Strategy lunches. You can keep up with what you miss thanks to David’s excellent synthesis of what was discussed. BR asked David to do the same for The Big Picture Conference; These are his notes (only lightly edited): ~~~ David Laubach: I got here a little late, missed Barofsky (heard he was excellent).
• Dylan Grice / Rich Yamarone A Great Disorder Comes Good quote from John Maynard Keynes in 1921, basically said: Inflation impoverishes a nation, secretly and quietly, creates enmity, but funds a government nonetheless. It's possible the Fed will NEVER remove the liquidity they've injected into the US economy, they may not have to, as inflation isn't running rampant (yet). In 2008, the big banks should have been allowed to fail, capitalism would have worked. Instead, interest rates are being pegged, creating distortions in the market. This is not exactly capitalism. Some European countries are raiding pension funds to claim that money as an asset on their balance sheets in order to make GDP/debt ratios look better. Although ZIRP might help win some battles in the short term, it can't win you the war. Japan has faced this same problem before, and opponents of their response will say that the BOJ did not try hard enough to escape deflation. Inflation can certainly be created. Great allegory about writing $1Trillion checks to everyone. The bond market is no longer a safe haven, as the risk/reward has dropped to unacceptable levels. Quality stocks and corporates are the safe havens now. France, then Germany, in that order are the next "problem spots" in Europe. Bond portfolios may crater prior to something showing up in France or Germany though. Japan is also scary. From the Q&A: Chinese protests about Japanese claims to islands seem somewhat "orchestrated", or at the very least blessed by the Chinese government. Japan should be building up their military right now in response. However, due to historical reasons, and a general lack of funds, they cannot afford to do so.
Inflation expectations are key, but velocity of money is so low right now, its hard to see anyone raising inflation expectations. However, they have started to inch higher after the last Fed announcement, this could play out as the recovery drags on. If inflation does rise to 3-4%, then the Fed could raise interest rates and cause a recession as a side effect. Instead, Fed will probably say that 4% inflation is acceptable and set 5% as the new warning level. Grice recommends reading Martin Gelbert's book about the history of the 20th Century where each chapter is one year. He's ten chapters in. Back in 1908, nobody really saw World War I coming. But WWI was preceded by a number of ethnic borders not coinciding with geopolitical borders causing tension in the Balkans. Grice sees a similar situation in the Middle East right now. The recent dramatic inflation in Iran could be a trigger to violence in the region, when you debase a currency, you debase a culture. Iran blamed and arrested currency speculators, what else is new? Whole thing is bothersome. ~~~ Jim O'Shaughnessy: What Works on Wall Street Study what markets will do over looooong cycles, not over the short term. Obviously, the March 2009 lows were a generational buying opportunity, BUT, he recognized this at the time. Nobody would listen, investors were frozen and could not bring themselves to act. Three things took place for the first time since the 1940's:
Following a period of negative GDP growth, stocks tend to do well over more than just a few quarters. Three things to look for in good stocks.
Investor behavior is important. People are hard-wired to make certain types of decisions. Its even genetic. Flipping a coin is generally better than expert consensus. Fear, Greed, and Hope wipe out gains from investing. ~~~ Barry Ritholtz. This is Your Brain on Stocks You can use your own notes for this. Wow, I actually do have a ton of notes on this though. I must have thought it was interesting. Humans exhibit a tendency toward a herd mentality, and feel like there is safety in numbers. Another Keynes quote I will butcher… "Better for one's reputation to fail conventionally, than succeed unconventionally". 5% of Wall Street recommendations were sells in May 2008. Just 5%. Equity analysts are too bullish and too bearish at EXACTLY the wrong times. This seems to be a monumentally successful contra-indicator. In August 2011, no S&P 1500 stock had a consensus sell rating from street analysts. There is a clear optimism bias among stockpickers (and humans in general). The ability to judge oneself is a skill in and of itself. And not everyone has the capability to accurately assess their own abilities. The more expertise one has, the awareness of weaknesses and flaws they have. The incompetent are nearly always over-confident. Experts are generally no better than the public at picking stocks. The more confidence someone has the more likely they are to persuade someone else. BUT More self confidence correlates to a worse track record when it comes to investing. So-called experts who are famous for hitting on a black swan event, tend to be worse at making predictions following their one success. (See Roubini.) People tend to read what they like and agree with and ignore and forget what they disagree with. This creates a gigantic positive feedback loop further evolving a person's sense of ability. Same goes for stocks, we cherish our successful picks, and forget the mistakes. Not good for learning. We also tend to overvalue recent trends over older trends. As if the more recent data should be weighted more. By the time news hits popular magazines (especially when the title reads "Is it too late to…"), its too late. In 2013, Taxes are going up, no matter what happens. Its not a good idea to invest with your emotions or based on a political outcome anyway. Humans value the anticipation of a financial reward even more so than the actual reward itself. This is pretty evident in a casino. Playing is often more fun than even winning. The economy could maybe use a little recession in the next few years to set up the next long term bull market. This one should run from 2000-2012/17, given average lengths. Contra-indicators and macro-economic factors really only come into play in investment decisions at the extreme tops and bottoms of markets. Rising volume is no longer as important as it was for confirming market movements. ETFs are now a significant part of the market, and Ma and Pa are out almost completely of stock picking. The Volume is not good, and High Frequency Trading distorts it anyway. If a recession took place right now, with 8% unemployment already in the economy, it tick up appreciably higher — 9-11% (really bad). So its hard to blame the Fed for doing everything possible to avoid one. By rescuing just about everyone who needs rescuing, we've created a slow, long recovery process. Unfortunately, nobody knows what would happen if we didn't do this. And we kinda knew what saving everyone would do. So go with the one you know. Of course, the unintended consequences of a "no recession at all costs policy" could end up being disastrous too. See TBTF, and hyper-inflation, or anything by any gold bug. The future is likely to be a mix of the two policies, maybe some pre-packaged bankruptcies. ~Sorry, you failed, but you can die peacefully, in this very nice convalescent home and we've already sorted your estate. Goodbye. ~~~ David Rosenberg: "Navigating the New Normal", but it could have been titled "Everything's really effed up." Finance is still a people business, this is good. You still have to go out and meet people (awesome, that what I was doing at the bar after this conference!). Real under-employment and unemployment is really around 15%, very high considering the stimulus. Other headwinds include ongoing real estate deflation, prices are down 43% from the highs. Household credit is still contracting and down from the highs. Household net worth is still declining over 5 year periods. The Great Recession is not over. Debt to assets and debt to income ratios want to revert to their means. This normally takes 5-7 years following a recession, this time it will take much longer. The distribution of outcomes has widened after this recession. Fat tails are everywhere. Not good for business. Agh, missed the Cicero quote from 55 BC, but it was a good one. The entire world's debt to GDP ratios are up 30% since 2007. This might be necessary in the short term, for stability, but ultimately, long term its unstable. Europe is heading into a recession and more unemployment. Monetary unions do not survive without fiscal unions and political unions. Europe is going to have to get a political union together, but not with all the current members. The US decoupling from Europe and the rest of the world was really just a lag behind it. There's no such thing as decoupling really, it just looks that way in the short term. The Asian crisis took 5 years to hit the US. There is an 84% Correlation between EU GDP and US. Europe's drop in production is already hitting Asia, and export shocks are on their way to the US. The US fiscal cliff will hit us and act like a 4% drag on GDP. Which is fine if you're growing at 7-8% or even a few points less. But we're not, we're growing at 1-2% maybe. In 2010, the lame duck congress got some things done for Obama, so maybe they get this done too. But don't hold your breath. From 2014-2020, interest rate payments will take up 20% of revenues and the US could cross the 100% debt to GDP ratio threshold during that time. Because of all of this uncertainty, capex spending has slowed recently. There might be a very very near term housing recovery, but in the long term, housing has a way to go. We've had ZIRP for 4 years, we are Japan. Carry trade is alive and well until 2015 at least, because Bernanke says so. The Fed wants to see price inflation, both Bernanke and Greenspan actively sought a wealth effect to take hold of the nation's citizens. Earnings are falling but the market is hitting new highs (last month). Most bond returns in the last year have been capital gains, when most equity gains have been yield and reinvested dividends. That's not right… The market in the 1930's was not as overbought as this one. Also there was no social safety net in the '30's, one third of the society was ag based. So that period is not really a great comp to today. Commercial and regional banks will pick up market share as big banks are regulated to death. Canadian banks can pick up some share too, they never had prop trading. Jim Bianco What Is The Fed's Plan And Will It Work? The Fed wants you to be rich, its not going to work.
Michael Belkin: Reality vs. Wishful Thinking: Bear Markets and the Business Cycle, a 110 Year View Lunch fatigue was setting in and I had reach my caffeine allotment for the day, oh no. That being said, Belkin was my favorite speaker. Never heard of him, and he was blunt and sounded really smart. Recession is coming, his charts say so. His charts are rarely wrong. Sell things, short the market. Especially tech. You CAN own consumer staples, utilities, healthcare, and MAYBE financials. Do not own Industrials, Materials, and especially tech. Recommended some spreads using sector ETFs. Doubt that's really the best strategy, but his chart reading was pretty awesome. Also, lives on Bainbridge, right next to Whidbey. Drives his boat to Whidbey sometimes. My in-laws live there. ~~~ Bill Gurtin: Muni's Don't know much about muni's, didn't take great notes. Muni investors are uneducated for the most part. 50% of them own muni's. Even their brokers are kinda stupid about them. There are market distortions that can be taken advantage of if you know what you're doing. California is an example. Yes, there are muni defaults there, but Cali has some decent laws about paying back investors, and a history of it, and sometimes things get hit just because they have a certain name on them, but when they really have very little to do with that city with the bad name. You can buy GO bonds, Lease bonds, Higher Ed bonds, Water bonds, and Utility bonds. Don't buy defaulted bonds, healthcare, or redevelopment bonds, those are bad.
Sal Arnuk, Scott Patterson, moderated by Josh Brown
|
| Posted: 13 Oct 2012 04:30 AM PDT My longer form reads to start your weekend:
What’s happening this weekend?
When Cheap Funds Cost Too Much |
| Gorgeous! New Aston Martin Vanquish Posted: 13 Oct 2012 04:00 AM PDT Via Classic Driver, we see this gorgeous new honey: The new Aston Martin Vanquish, yours for just £189,995. The stats:
click for larger image
~~~
~~~
More pics after the jump
~~~
~~~
~~~
~~~
Source: |
| The Big Interview: World Bank President Jim Yong Kim Posted: 13 Oct 2012 03:48 AM PDT In a wide-ranging conversation, World Bank President Jim Yong Kim discusses the Europe crisis, the risks to developing countries, his aim to end poverty, and China’s transition from borrower to leader with Tokyo bureau chief Jacob M. Schlesinger. |
| Where Would the Federal Funds Rate Be, If It Could Be Negative? Posted: 13 Oct 2012 03:00 AM PDT Where Would the Federal Funds Rate Be, If It Could Be Negative?
In the wake of Great Recession, the Federal Reserve engaged in conventional monetary policy actions by reducing the federal funds rate. But soon the rate hit zero, and could go no lower. In such environments, policymakers still think in terms of where the federal funds rate should be, were it possible to go negative. To project the "unconstrained path" of the funds rate—ignoring the zero lower bound—and to identify the key underlying shocks driving that path, we employ a statistical macroeconomic forecasting model. We find that the federal funds rate would have been extremely negative during 2009-2010. At the press conference following the April 2012 FOMC meeting, a reporter asked Chairman Bernanke where he thought the federal funds rate would be if it could go below zero. Bernanke replied that the answer would depend on the model used and the assumptions made. We attempt to address this question empirically by employing a particular statistical model. As the U.S. economy showed signs of weakness in 2007, monetary policy actions reduced the federal funds rate by almost 100 basis points over the course of the year, from a high of 5.25 percent to 4.25 percent. These monetary policy actions, from most vantage points, appeared conventional and relatively comparable to the extent of the economic slowdown to that point. In contrast, the financial crisis in the fall of 2008 coincided with the beginning of the sharpest and deepest contraction of the recession. In response, the Federal Reserve lowered the federal funds rate target to a range of 0 percent to 0.25 percent. The federal funds rate is a nominal interest rate and cannot go below zero, a constraint known as the zero lower bound (ZLB). Once the rate arrived at the bound, conventional monetary policy could do no more. Yet the economy remained weak. Unemployment increased dramatically from 6.9 percent in 2008:Q4 (on a quarterly average basis) to a peak of 9.9 percent in 2009:Q4. Similarly, real GDP contracted further in 2009. To address this weakness, the Federal Reserve turned to nonconventional policies, but researchers—and journalists—wonder what the path of the federal funds rate would have been under these circumstances, were it unconstrained by the ZLB. We use a model to project that path. The type of model we employ is a statistical model of the U.S. economy that is estimated using quarterly macroeconomic and financial data from 1959 through 2008. It provides a statistical characterization of the way monetary policy typically responds to changes in the other variables in the model over this period. The model predicts that the unconstrained federal funds rate would have fallen far below the zero lower bound by as much as 5 to 6 percentage points during 2009-2010. Conventional Monetary Policy InstrumentThe Federal Reserve conducts conventional monetary policy by targeting the federal funds rate, the rate that banks charge each other for overnight loans of their reserves held with the Fed. The Federal Reserve can directly influence this rate because its transactions with private market banks affect the total supply of bank reserves. Banks are required to hold a minimum level of reserves against their deposits, and banks may borrow reserves to meet those requirements or to make additional loans to customers. Monetary policy affects the real economy because the level of the federal funds rate sets the opportunity cost for additional funds for banks. The cost of these funds then influences the level of interest rates that banks charge customers for loans, as well as the level of other market interest rates. Higher interest rates (all other things the same) raise the cost of borrowing and tend to reduce loan and investment activity, whereas lower interest rates (all other things the same) reduce the cost of borrowing and tend to increase loan and investment activity. Federal Reserve monetary policy aims to achieve its statutory goals of low inflation and maximum employment. This dual mandate has been often characterized as a balancing act—trying to achieve lower unemployment while maintaining low inflation. The frequent criticism of Fed policies reflects the difficulty of setting the "correct" federal funds rate to achieve these goals. In past economic cycles, the level of the federal funds rate appears to have responded to movements in the rate of inflation as well as to movements in real output and unemployment. The popular Taylor rule characterizes monetary policy as responding to deviations from target inflation and deviations from potential output or the natural rate of unemployment. The monetary policy "reaction function" in the empirical model used in our analysis is more general, and characterizes monetary policy as responding to a larger set of variables. That said, the most important determinants of movements in the federal funds rate are real output and unemployment.1 The results and analysis that follow are dependent on the particular model that we use and the implied monetary policy rule embedded in it. That is, the same modeling techniques used on a different set of variables or over a different sample time period would likely generate results with greater or lesser magnitudes (and possibly different interpretations) of federal funds rate responses. However, our statistical model of the economy is areasonable starting point for the analysis of this issue. This class of statistical models aims at characterizing the movements of the data series with minimal restrictions on the data interrelationships. As a result, the model used in our exercise can capture and illustrate various complex dynamic relationships among the variables of interest. Forecasting ModelFor the analysis, we employ a medium-scale version of a popular class of models used by macroeconomists for forecasting called Vector Autoregressive (VAR) models. VAR models consist of equations relating the current value of each variable to past values of all variables of the model including its own. These models capture historical statistical correlations between the variables of the model, and the model's forecasts display the projection forward of these summarized correlations. The specific model that we use is the model described in Ken Beauchemin and Saeed Zaman's paper, "A Medium Scale Forecasting Model for Monetary Policy." It contains 17 variables (table 1), and to improve its forecast accuracy, it is estimated with prior restrictions imposed on the model's parameters.2 These prior restrictions are known as Bayesian priors, and their use makes this model a BVAR. In this model, the monetary policy reaction function—the way monetary policy as measured by the federal funds rate responds to movements in other variables—is an implied one. That is, the reaction function is determined by the equation in the model that corresponds to the federal funds rate, which includes the lagged observations of all 17 variables in the BVAR.3 The BVAR reaction function contrasts with a Taylor rule in that the reaction function of monetary policy in the Taylor rule is explicitly characterized in terms of a small set of variables as noted above. The Unconstrained Path of the Federal Funds RateWe use this model to address the question of what the path of the federal funds rate might have been had the zero lower bound not been binding on policy. To do this, we estimate the model in a way that generates a "conditional" forecast of the federal funds rate in the wake of the Great Recession, representing the "unconstrained" path of the rate over this period. Specifically, the exercise uses the model to compute a "forecast" for the federal funds rate path from the beginning of the recession to the second quarter of 2012. Unlike a standard, unconditional forecast, which would generate forecasts for future periods (starting in 2008:Q4) and subsequently employ forecast values for all variables for those periods as the forecast horizon extends out toward the end of the forecast sample, we plug in the actual values except for the federal funds rate. The mental experiment is the following: suppose we could know the values of all the other variables of our model in real time (no waiting for data gathering, reporting, and revising). Our model would tell us how the federal funds rate would typically respond to the evolving state of the economy—given the historical relationships as captured by our economic model. First, we estimate the parameters for the 17 variables of the BVAR model using all the data from 1959:Q1 through 2008:Q3.4 Next, using the model with the estimated parameters, we forecast the federal funds rate for the next three years—14 quarters starting from 2008:Q4 to 2012:Q2. Figure 1 shows the conditional forecast of the federal funds rate, with the mean forecast and the associated 70 and 90 percent probability bands. As the data following the financial crisis passes into the model, the forecast of the federal funds rate becomes negative immediately in 2009:Q1. It reaches its nadir of −5 percent in 2009:Q3. And by the end of 2012:Q2 it is −2 percent. Also included in the figure for reference purposes is the federal funds rate implied by a Taylor rule with core inflation and the unemployment gap.5 The trajectory of the fed funds rate implied by the Taylor rule is roughly similar to the model's conditional forecast of the federal funds rate (it is within the 70 percent error bounds of the model).
The model forecast of the funds rate turns negative in response to the severity of the economic contraction. The sharp movements in the other data series from 2008 onward called for substantial monetary accommodation. They implied a lowering of the federal funds rate by more than 500 basis points (from 0.25 percent in 2008:Q4 to −5 percent in 2009:Q3).
Underlying Sources of the Federal Funds Rate PathThe conditional forecast indicates how the model would have predicted the level of the funds rate in response to the actual observation of the other data series in the model. However, the forecast indicates the combined effect of the paths of these series on the funds rate forecast. We want to uncover the identity of the key variables that determined the outcome. To address this question, we estimate the model in a different way, one that generates an unconditional forecast. The unconditional forecast as described above uses the actual values of data up to a given date—say 2008:Q3—to estimate the model and then generates forecasts of the future values of all the data series in the model. These forecasts are compared to actual values (not generated by the model), and the differences are analyzed to reveal the contribution of the different data series to the trajectory of the fed funds rate. (Recall that the conditional forecast employs actual values rather than forecasts for all variables except the federal funds rate.) Economists refer to a "forecast error" as the difference between the actual data and the unconditional forecast. Forecast errors are typically correlated contemporaneously, meaning that forecast errors for real GDP and real consumption dated 2009:Q1 are (positively) correlated. Such an observation indicates how challenging it can be to identify whether a forecast error in real consumption arises from an inability to predict real consumption or an inability to predict real GDP or both. In order to get a sense of the underlying forces driving the federal funds rate forecast into negative territory, we decompose each variable's forecast error into a function of all the uncorrelated "shocks" in the model.6 The forecast error of the federal funds rate is decomposed into the uncorrelated shocks of all 17 variables. This exercise, known as historical decomposition, involves forecasting the federal funds rate from 2008:Q4 through 2012:Q and computing the forecast errors. We can then distinguish the proportion of the forecast error that arises from each individual uncorrelated shock series. Figure 2 plots the unconditional forecast of the federal funds rate using only data available through 2008:Q3; notice that this forecast falls slightly negative through most of 2009 and 2010 and reaches a trough of about −0.6 percent at 2010:Q1. The difference between the unconditional forecast and the actual federal funds rate is the forecast error measure described above.
Using the actual data for all the other variables, we can decompose the source of the forecast errors for the fed funds rate. Specifically, we can isolate the contribution of the uncorrelated shocks associated with other variables (as well as for the federal funds rate) to the forecast error. We could plot 17 individual conditional forecast lines of the federal funds rate, each differing depending on which of the 17 shocks is added to the original unconditional funds rate forecast. But for the sake of brevity, we group the 17 shocks in three groups; one plot shows the conditional forecast of the federal funds rate due to financial shocks only (that is, the 10-year yield, the BAA yield, the SP500, the SP500 dividend yield, and the exchange rate); another shows the forecast with real GDP and the unemployment rate shocks only; and the last one shows the forecast of the federal funds rate due to all shocks except the fed funds rate shock. The orange line, therefore, introduces the additional knowledge of the shocks in all other variables in the model except for the orthogonal shock in the federal funds rate. Roughly in line with the conditional forecast, historical decomposition suggests that as the financial crisis hit, the combined effect of the 16 shocks forces the federal funds rate significantly lower, to about −5.50 percent by 2009:Q2 (red line). The magnitude and persistence of the combination of the 16 shocks force the fed funds rate significantly below zero throughout the sample period considered. The arrow shows the direction of the fed funds rate shock. The zero lower bound constraint forces the shock associated with the federal funds rate to be positive and large. This outcome arises because the sum of influence of all the other shocks on the federal funds rate is negative and all the shocks (that is, the 17 including the federal funds rate) added to the unconditional funds rate forecast should sum to the orange line representing the actual funds rate. Hence, the zero lower bound in this model imposes a severe restriction on the model outcome for the federal funds rate and implies what is effectively a monetary tightening.7 The relative contribution of the different data series to the federal funds rate forecast can be gauged by comparing the distance of each grouping's conditional forecast to that of the forecast with all the shocks except the funds rate orange line). Real GDP and the unemployment rate contribute the most, and together they exert negative pressure on the funds rate forecast throughout the forecast period. From 2010:Q4 it is other variables, including the financial ones, that improve enough to pull the funds rate forecast above a plateau of around −4 percent. The financial variables contribute less than GDP and unemployment but still they account for a significant portion of the forecast path. Unconventional ToolsMonetary policy makers have employed unconventional tools to mitigate the zero lower bound constraint. For example, some policies aim at lowering long-term interest rates through purchases of longer-term Treasury securities, agency debt, and mortgage-backed securities. The actions have been called large scale asset purchases, and the specific events have been referred to as quantitative easing, with acronyms QE1 and QE2. (A more recent policy with the same aim involves maturity exchanges—where the Fed sells short-term Treasury securities and buys long-term Treasury securities in the same dollar amount—and has been nicknamed Operation Twist.) Furthermore, communications strategies, such as providing forward guidance on the federal funds rate in regular FOMC statements and publishing interest rate forecasts (as part of the Survey of Economic Projections) of the various FOMC participants, are other ways nontraditional policy is being implemented. These actions are intended to guide market expectations of the future short-term rate path. Absent these unconventional policies, our model would likely have been conditioned on more adverse economic outcomes—specifically, a higher long-term interest rate and the related undesirable effects on unemployment and real output growth—which would have forced the fed funds rate to be even more negative. That said, our model analysis does not attempt to calculate the effect of those policies. ConclusionUsing a particular class of statistical model, we have estimated the path of the federal funds rate had it not been constrained by zero lower bound. We show that the magnitude and persistence of adverse shocks experienced in the recent financial crisis would have forced the federal funds rate significantly below zero in this model. The model's forecast suggests that the inability of the nominal federal funds rate to fall below zero was a binding constraint on the typical policy response in the path of the federal funds rate in this model. Policy makers employed unconventional methods to mitigate the restraint imposed by the zero lower bound by using quantitative easing stimulus. Some researchers estimate that these actions were equivalent to driving the federal funds rate to as low as negative 3 percent, but those findings are debatable. 8 In sum, we suggest that the zero lower bound was binding to a great extent. References"The Fed's Monetary Policy Response to the Current Crisis," Glenn D. Rudebusch, 2009. Federal Reserve Bank of San Francisco, Economic Letter, no. 2009-17. "The Fed's Exit Strategy for Monetary Policy," Glenn D. Rudebusch, 2010. Federal Reserve Bank of San Francisco, Economic Letter, no. 2010-18. "Large-Scale Asset Purchases by the Federal Reserve: Did They Work?" Joseph Gagnon, Matthew Raskin, Julie Remache, and Brian Sack, 2010. Federal Reserve Bank of New York, Staff Report no. 441. "Have We Underestimated the Likelihood and Severity of Zero Lower Bound Events?" Hess Chung, Jean-Philippe Laforte, David Reifschneider, and John C. Williams, 2011. Federal Reserve Bank of San Francisco, working paper no. 2011-01. "Signals from Unconventional Monetary Policy," Michael Bauer and Glenn Rudebusch, 2011. Federal Reserve Bank of San Francisco, Economic Letter, no. 2011-36. "The Effectiveness of Alternative Monetary Policy Tools in a Zero Lower Bound Environment," James Hamilton and Jing (Cynthia) Wu, 2011. Unpublished manuscript, University of California, San Diego. "Operation Twist and the Effect of Large-Scale Asset Purchases," Titan Alon and Eric Swanson, 2011. Federal Reserve Bank of San Francisco, Economic Letter, no. 2011-13. "A Medium Scale Forecasting Model for Monetary Policy," Kenneth Beauchemin, and Saeed Zaman, 2011. Federal Reserve Bank of Cleveland, working paper no. 11-28. "Large Bayesian Vector Autoregressions," Marta Banbura, Domenico Giannone, and Lucrezia Reichlin, 2010. Journal of Applied Econometrics, 25(1), 71-92. "Vector Autoregressions: Forecasting and Reality," John C. Robertson and Ellis W. Tallman, 1999. Federal Reserve Bank of Atlanta, Economic Review, (Q1), 4-18. "Forecasting and Conditional Projection Using Realistic Prior Distributions," Thomas Doan, Robert B. Litterman, and Christopher A. Sims, 1984. Econometric Reviews, 3, 1-100. "A Bayesian Procedure for Forecasting with Vector Autoregression," Robert B. Litterman, 1980. Massachusetts Institute of Technology, Department of Economics, working paper. "A Historical Analysis of Monetary Policy Rules," John Taylor, 1999. Footnotes
|


| You are subscribed to email updates from The Big Picture To stop receiving these emails, you may unsubscribe now. | Email delivery powered by Google |
| Google Inc., 20 West Kinzie, Chicago IL USA 60610 | |


0 comments:
Post a Comment