


The Big Picture |
- The Credibility of Exchange Rate Pegs and Bank Distress in Historical Perspective
- Federal Judge Strikes Down NSA’s Bulk Metadata Program
- If all the ice melted…
- 10 Monday PM Reads
- Kass: 10 Laws of Stock Market Bubbles
- 10 Monday AM Reads
- Am I Too Bullish?
- Forward Markets: Macro Strategy Review
- 60 Minutes: NSA speaks out on Snowden, spying
| The Credibility of Exchange Rate Pegs and Bank Distress in Historical Perspective Posted: 17 Dec 2013 02:00 AM PST |
| Federal Judge Strikes Down NSA’s Bulk Metadata Program Posted: 17 Dec 2013 01:00 AM PST "I Cannot Imagine a More 'Indiscriminate' and 'Arbitrary Invasion' Than This Systematic and High-Tech Collection and Retention of Personal Data On Virtually Every Single Citizen"~~~ "The Government Does Not Cite A Single Instance In Which Analysis Of The NSA's Bulk Metadata Collection Actually Stopped An Imminent Attack"A federal court has just struck down the NSA's bulk metadata spying program today. The court notes:
The judge is right:
|
| Posted: 16 Dec 2013 04:30 PM PST Click for an interactive map. |
| Posted: 16 Dec 2013 01:30 PM PST Here’s what I’m reading on the train-ride home today:
What are you reading?
As Inflation View Shifts, the Fed Might Floor It |
| Kass: 10 Laws of Stock Market Bubbles Posted: 16 Dec 2013 10:15 AM PST I like this list from Dougie:
Based on this, ts tough to claim this is presently a bubble.
Source: |
| Posted: 16 Dec 2013 06:31 AM PST Good Monday morning. Here is what I'm reading to start the week:
Continues here
|
| Posted: 16 Dec 2013 04:34 AM PST Over the past few weeks, I have been trying to push back against the usual contingent of bears. In particular, I have argued that this bull cycle is not yet over, markets are not in bubble and that people have been sitting for too long in way too much cash. John Coumarianos of the Institutional Imperative is a prudent value guy. He wonders aloud in a recent blog post if I am too bullish?. He raises a number of interesting points via (mostly) valid criticisms. I am not a rampaging bull, but if I come across that way to a reasonable guy such as John, then I am probably miscommunicating my thoughts. I am going to use his critique as a jumping off point to clarify some ideas and positions. I know that nuance and subtly are not necessarily my strong suits — nor the Internet's, for that matter — but I will avoid all hyperbole in this discussion, click-throughs be damned.
Continued here |
| Forward Markets: Macro Strategy Review Posted: 16 Dec 2013 03:30 AM PST December 20 Our family at Forward hopes you and your family have a holiday season filled with happiness and joy. Forward Markets: Macro Strategy Review Federal Reserve "If at first you don't succeed, try, try again. Don't give up too easily; persistence pays off in the end." This proverb was first published in 1840 in a book written by American educator Thomas Palmer, titled "Teacher's Manual." The original intent of the saying was to encourage students to not give up if they struggled to learn the three R's – reading, writing and arithmetic. Over time, the concept of trying again and again has been broadened to almost every endeavor. Thomas Edison was famous for his many inventions that helped transform the standard of living for all the generations of Americans who followed. He certainly had a different perspective on failure: "I have not failed. I've just found 10,000 ways that won't work." But Edison was a true believer in persistence: "Genius is 1 percent inspiration and 99 percent perspiration." Stars are frequently born in our culture with the help of the media, but our admiration is greater for those who become a success after 10, 15 or 20 years of hard work.
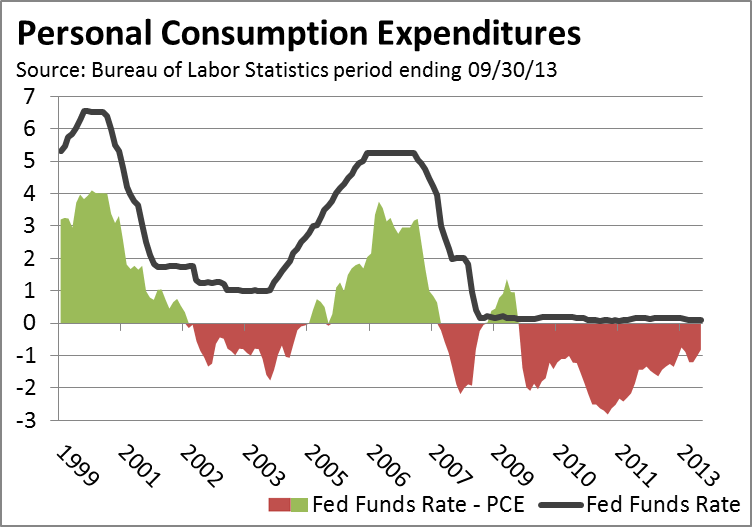
What this analysis underscores is that the elephant in the room is global deflation. When the financial crisis erupted in 2008, policymakers had the capacity to lower interest rates and use large budget deficits to combat the economic contraction that followed. Although these actions were successful in preventing a deflationary collapse in 2009, policymakers are now left with relatively weak global growth, far more debt and only hard choices on how monetary policy can be normalized without risking a slowing of growth. Any increase in interest rates will claim a larger share of cash flow for debt service, leaving less for consumption of goods and services, and increase interest expense in government budgets. Any reduction in aggregate demand, as a result of higher interest rates and debt service payments, will slow GDP growth and result in less tax revenue. The narrowing of the budget deficit in the U.S. in recent years could stall, or worsen, should interest rates rise meaningfully. The Congressional Budget Office estimates a 1.0% interest rate increase would cost the Treasury $100 billion a year on the $17 trillion in outstanding debt.
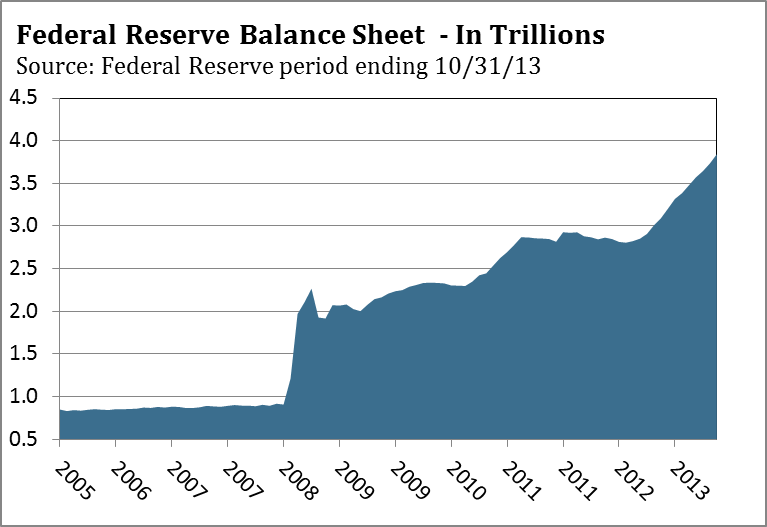
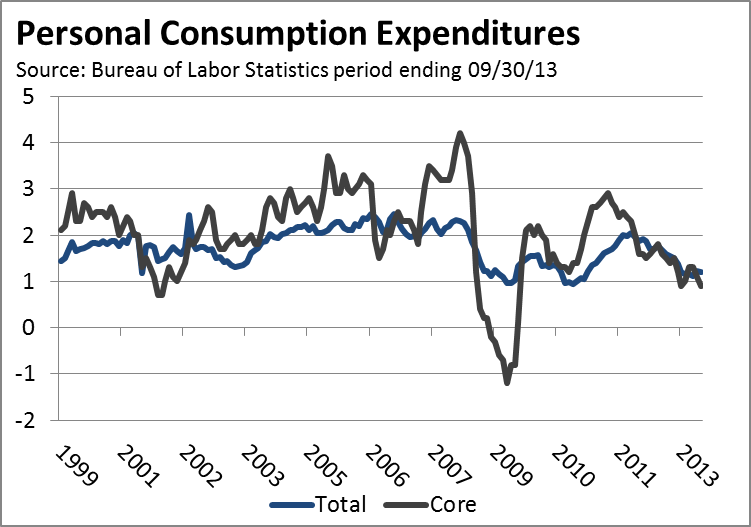
In the movie Apollo 13, the astronauts had one chance to get their re-entry into the Earth's atmosphere right. If the shuttle came in too shallow, they risked bouncing off the atmosphere and being lost in space. Coming in at too severe an angle would have caused them to enter the atmosphere too fast and heightened their risk of burning up. The Federal Reserve faces much the same dilemma. The Fed has spent five years nursing the economy back to health and a premature exit from QE3 could undo five years of effort. This is why the Fed is willing to accept the risk of more inflation down the road for maintaining QE3 until their confidence is higher. Based on the Federal Reserve's dual mandate of stable prices and maximum employment, the Fed has the cover under each mandate to continue QE3. Inflation is below the Fed's acceptable target of 2.5%, which was increased from 2.0% at the December 2012 FOMC meeting. In September, producer prices were up 1.2% from 2012, while the Consumer Price Index increased only 1.0% in October from 2012, as reported by the Bureau of Labor Statistics. The Personal Consumption Expenditures Deflator, which is the Fed's preferred inflation barometer, was up only 0.9% from September 2012. Equally important, each of these inflation indicators has been trending lower since the first half of 2011, which suggests the risk of deflation is increasing despite QE3.
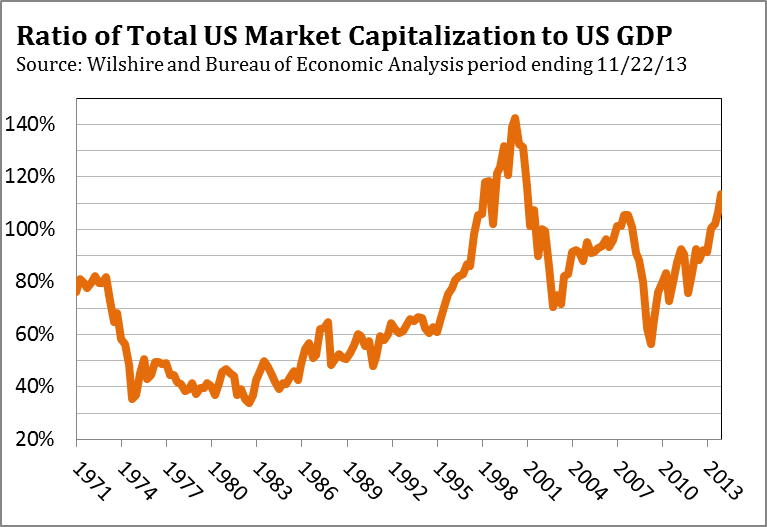
The Federal Reserve was a spectator as the dot-com bubble blew valuations in the stock market to the moon and when housing prices became unhinged from median income while lending standards evaporated. Naturally, after five years of 0% interest rates and trillions in quantitative easing, Yellen was asked during her Senate nomination testimony about asset bubbles. Her overall assessment was the following: "At this point, I don't see a risk to financial stability, although there are limited signs of a reach for yield."3 According to the Investment Company Institute, of all the money that has been invested in bond funds since 1986, 60% of the total has been invested in just the last four years. The enormous bond inflows during the last four years suggest investors have been manically lunging for yield, rather than simply reaching for yield. It should be noted that this inflow occurred with bond yields providing their lowest return of the past 27 years, so the capital risk versus reward is asymmetrically tilted toward risk. A modest increase in interest rates can easily wipe out more of a bond investor's capital than the annual income received from the investment. According to platform provider Dealogic, almost $900 billion of high-rated bonds have been sold through October of this year, the most since 1995 when they began keeping records. If the current pace continues, this year will top last year's record issuance of $1.01 trillion in debt. Corporations have been able to sell this record volume of debt because demand is high from investors desperate for yield. Recently, the spread between corporate and Treasury bonds was 1.32%, just above 1.30% reached on May 22, before the onslaught of tapering talk upset the bond market. In late October, the Financial Times reported the revival of "payment-in-kind toggle" bonds, which let borrowers pay interest in more debt if they don't have the cash to make the interest payment. Sounds like a debt Ponzi scheme reminiscent of the heady days of 2007 when covenant–lite loans were the rage. Despite these signs of excess in the credit market, the Federal Reserve is unlikely to heed W. C. Fields advice: "If at first you don't succeed, try, try again. Then quit. No use being a damn fool about it." As for the stock market, Yellen acknowledged at the Senate Committee meeting that "stock prices have risen pretty robustly." But at current valuations the stock market is "not in a territory that suggests bubble like conditions."4 On the surface this appears accurate, since the S&P 500 Index is selling at 16 times 2013 earnings. However, a number of factors suggest that earnings aren't as solid as they might appear and have been boosted by tailwinds that may diminish in coming quarters. Profit margins are at an all-time high, in part because companies are not hiring or increasing wages. According to the Bureau of Economic Analysis, as of September 30, 2012, corporate profits were 14.2% of national income, the highest since 1950. Workers' earnings were only 61.7% of national income, the lowest since 1966. The pace of hiring and wage increases haven't changed much since September 2012, so these figures are still representative of the current climate. Through the efforts of the Federal Reserve, interest rates have been historically low for a number of years, which has enabled corporations to significantly lower interest expense. According to MacroMavens, a macroeconomic research provider, interest expense in 2013 will be approximately $169 billion, down from $488 billion in 2007. Interest expense is more likely to rise in coming years, as interest rates become normalized with historical averages. Corporations have purchased more than $800 billion in stock through buybacks over the last two years, with $120 billion occurring in the second quarter of 2013. As the number of shares outstanding are reduced, earnings per share increase, which lowers a company's price-earnings (P/E) ratio. According to J. P. Morgan, 60% of the increase in earnings since 2011 has come from stock buybacks, rather than organic growth. Since companies have been able to borrow so cheaply, some of these purchases were funded by the $2 trillion in corporate debt issued during the last two years. Buying back stock may improve short-term results (making stock options held by company executives more valuable), but not investing in research and development for long-term future growth is not good for most companies or our country. Corporate earnings have also benefited from the widespread use of adjusted operating earnings, rather than Generally Accepted Accounting Principles (GAAP), which are more conservative since they allow less wiggle room in how some items are expensed. According to Standard & Poor's, 2012 total earnings per share for the companies in the S&P 500 would have been $86.51 under GAAP accounting, rather than the $96.82 in operating earnings as reported by some companies. In effect, operative earnings were overstated by as much as 11.9% as compared to GAAP earnings. If the same pattern holds for 2013, the S&P 500's P/E ratio is closer to 17.9 than 16.0. In addition to the special factors that have padded earnings in recent years, other methods of calculating valuation suggest the stock market isn't as "fairly" valued as the S&P 500's P/E ratio suggests. As discussed in last month's commentary, Nobel Laureate James Tobin's Q ratio is currently near levels when the market has been overvalued in the past—1906, 1929, 1937 and 1968. A similar valuation assessment is revealed by Nobel Laureate Robert Shiller's cyclically adjusted price-earnings (CAPE) ratio, which is currently almost 50% above its 142-year long-term average. The only instances when the stock market was more expensive were in 1929 and 1999-2000. Another valuation method that also indicates the market is modestly expensive compares the stock market capitalization to GDP. As of November 19, the stock market's capitalization as measured by the Wilshire 5000 Total Market Index was $18.9 trillion, which is 112.3% of GDP ($16.85 trillion) as of September 30. This level is higher than 96% of all the market days since World War II. In a Fortune magazine interview in 2001, Warren Buffett said the percentage of total market cap relative to the U.S. GDP is "probably the best single measure of where valuations stand at any given moment."5 No surprise then that last month Warren Buffett said he was having trouble finding stocks to buy.
The Federal Reserve has forecast that GDP will accelerate in 2014 to above 3.0%, which is the same forecast made in 2012 and 2013. If GDP does not pick up as forecast, Janet Yellen made her position clear in her testimony: "I consider it imperative that we do what we can to promote a very strong recovery."7 Even through the Fed has not succeeded in establishing a strong recovery after five years of extraordinary monetary accommodation, Yellen made it clear the Fed will try and try again. At some point Yellen and the other members of the FOMC may have to consider what Albert Einstein said about extreme persistence: "Insanity is doing the same thing over and over again and expecting different results." U.S. Economy In January of this year, the Federal Reserve forecast that the economy would accelerate in the second half of the year, with GDP growth rising to 3.0% or better. The consensus among private economists was the pickup in the economy would occur as the impact of the tax increases in January diminished. Our view was that growth in 2013 would hover near 2.0%, and wouldn't accelerate to 3.0% as forecast, since we didn't see a catalyst that would boost job and income growth to offset the drag from higher taxes and the sequester. Although the Commerce Department reported that third quarter GDP rose to 3.6% from 2.5% in the second quarter, the headline number was a bit misleading. As we have discussed in prior commentaries, real final sales is a more consistent assessment of the economy's health than GDP, since final sales provide a cleaner indication of demand. Changes in inventories either add or subtract from the quarterly GDP estimates, and have a tendency to make the economy look stronger or weaker than it really is. In the third quarter, businesses made significant increases to their inventories, which added 1.7% to GDP. After such a big boost to inventory levels in the third quarter, businesses probably won't add to their existing inventory as much in the fourth quarter. If this proves true, the decline in inventory additions in the fourth quarter from the third quarter will be subtracted from fourth quarter GDP. The swings in inventories represent a level of noise that final sales ignore. In the third quarter real final sales, which is GDP less changes in private inventories, were up 1.9% versus a gain of 2.1% in the second quarter. Based on real final sales, the economy didn't strengthen at all during the third quarter. The GDP headline gave the appearance of acceleration from the second quarter, since it included the 1.7% boost from inventories.
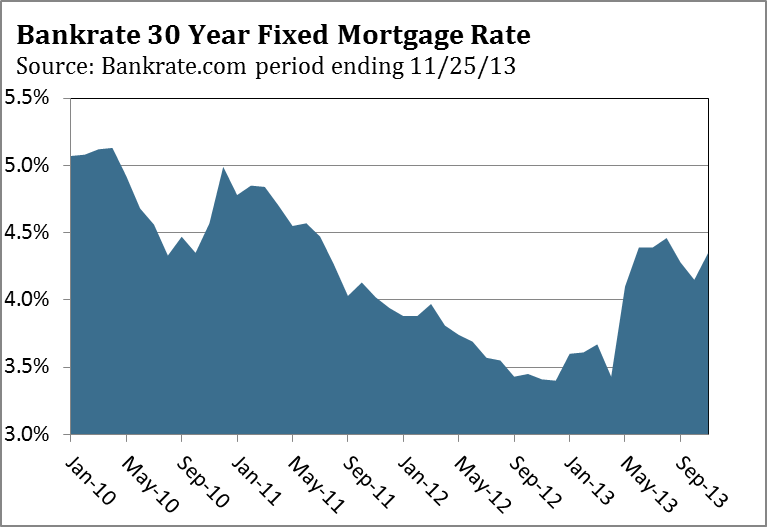
The disappointing rollout of the Affordable Care Act and the uncertainty consumers and businesses are encountering is likely to extend into the first quarter of 2014. The approval rating of both political parties and the president has made new lows in recent weeks, according to recent polls. The lack of leadership and progress on the many challenges facing our country is apparent in the drop in consumer confidence, which fell to a two-year low in late October. Businesses and consumers are likely to invest less and spend less until more clarity develops around the costs and benefits of the Affordable Care Act, since healthcare represents almost 18% of GDP. In the last two years, housing has rebounded and auto sales have jumped, as the Federal Reserve continued its extraordinary monetary accommodation. Despite these positives, GDP held around 2.0% in both years. As we enter 2014, mortgage rates are likely to be higher, and the slowdown in housing we discussed in our July commentary is occurring. We have no idea when the Federal Reserve will begin to scale back its QE3 purchases. In a perfect world, the economy will accelerate as the Fed has forecast, making the decision to taper easy. We don't expect the economy to grow 3.0% anytime soon, which is likely to keep the financial markets hanging, parsing every speech and data point. Eurozone
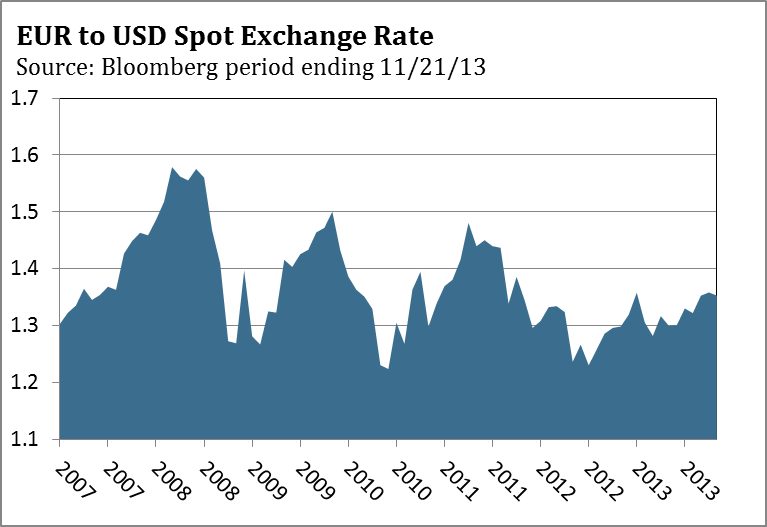
We expect the euro to weaken in 2014 from 135.00 to 128.00, with an even lower value a real possibility. Greece will likely require a third bailout and Portugal's current bailout expires in mid-2014. If these bailouts don't go smoothly, the euro could break support near 127.00 and head toward 120.00. Stocks Since the low in March 2009, the S&P 500 has continued to make higher highs and higher lows, which is the definition of an uptrend. Until the S&P 500 drops below a prior low, the major trend is up. The market has benefited from a lack of reasons to sell, which has kept selling pressure very low. Most money managers and mutual fund managers are bottom-up investors, looking for companies with solid balance sheets, strong management teams and opportunities to grow their businesses over the next three to five years. With the overall macro environment looking relatively stable, there are no macro factors currently giving investors a reason to sell. However, there are a number of issues that could elevate macro concerns in 2014. The Federal Reserve may choose to reduce QE3 purchases even if the economy is not as strong as forecast, the unemployment rate is higher than desired and inflation is lower than its 2.5% target. European growth is likely to remain abysmal, which could exacerbate tensions between Germany and southern European countries that are enduring depression levels of youth unemployment. Greece and Portugal are likely to require another bailout package and face more austerity measures to receive additional financial assistance that could prove very unpopular. Should the Fed begin to lower its QE3 security purchases, India, Brazil, Indonesia, Turkey and other developing nations could experience another period of weakness in their respective currency. This currency weakness could result in higher inflation and additional rate increases by central banks to deal with a plunging currency and inflation, as they did last summer.
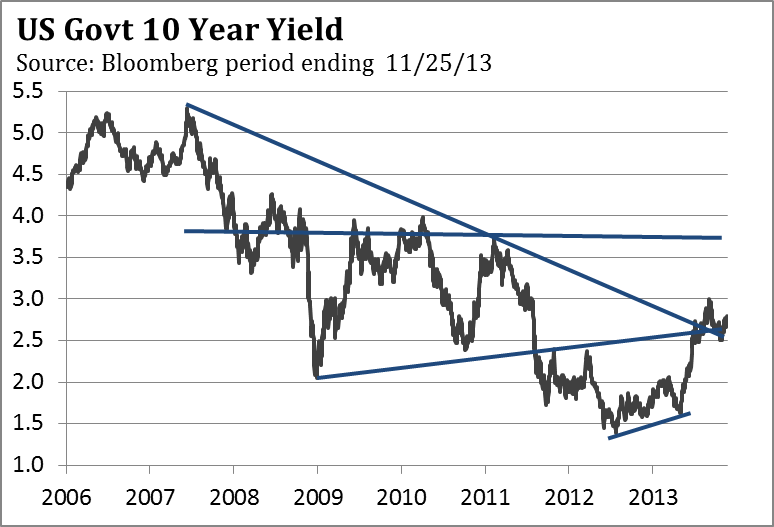
Bonds
Jim Welsh, David Martin, Jim O'Donnell Definition of Terms 10-Year Treasury is a debt obligation issued by the U.S. Treasury that has a term of more than one year, but not more than 10 years. AA is a Standard & Poor's long-term credit rating that reflects a bond issuer's financial strength, or its ability to meet its financial commitments in a timely fashion. AA is the second highest rating and is given when an issuer's capacity to meet its long-term debt obligations is very strong. Consumer Price Index (CPI) is an index number measuring the average price of consumer goods and services purchased by households. The percent change in the CPI is a measure of inflation. Covenant-lite loan is a type of loan whereby financing is given with limited restrictions on the debt-service capabilities of the borrower. Cyclically adjusted price-earnings (CAPE) ratio is the ratio of stock prices to the moving average of the previous 10 years' earnings, deflated by the Consumer Price Index. Federal funds rate is the interest rate at which a depository institution lends immediately available funds to another depository institution overnight. Federal Open Market Committee (FOMC) is the branch of the Federal Reserve Board that determines the direction of monetary policy. Mortgage-backed security (MBS) is a type of asset-backed security that is secured by a mortgage or collection of mortgages. NYSE Advance/Decline Line is a technical indicator that plots changes in the value of the advance-decline index over a certain time period. Personal Consumption Expenditure Deflator measures the average change over time in the price paid for all consumer purchases. Price-earnings (P/E) ratio is a valuation ratio of a company’s current share price compared to its per-share earnings. Purchasing Managers Index (PMI) is an indicator of the economic health of the manufacturing sector. PMI is based on five major indicators: new orders, inventory levels, production, supplier deliveries and the employment environment. Q ratio is a ratio devised by Nobel Laureate James Tobin that suggests that the combined market value of all the companies in the stock market should be about equal to their replacement costs. Quantitative easing (QE) refers to a form of monetary policy used to stimulate an economy where interest rates are either at, or close to, zero. S&P 500 Index is an unmanaged index of 500 common stocks chosen to reflect the industries in the U.S. economy. Valuation is the process of determining the value of an asset or company based on earnings and the market value of assets. Wilshire 5000 Total Market Index represents the broadest index for the U.S. equity market, measuring the performance of all U.S. equity securities with readily available price data. One cannot invest directly in an index. RISKS Investing involves risk, including possible loss of principal. The value of any financial instruments or markets mentioned herein can fall as well as rise. Past performance does not guarantee future results. This material is distributed for informational purposes only and should not be considered as investment advice, a recommendation of any particular security, strategy or investment product, or as an offer or solicitation with respect to the purchase or sale of any investment. Statistics, prices, estimates, forward-looking statements, and other information contained herein have been obtained from sources believed to be reliable, but no guarantee is given as to their accuracy or completeness. All expressions of opinion are subject to change without notice. Jim Welsh is a registered representative of ALPS Distributors, Inc. 1 Barron's Streetwise, "Heads, You Win – Tails, You Win," November 16, 2013. |
| 60 Minutes: NSA speaks out on Snowden, spying Posted: 16 Dec 2013 03:00 AM PST The NSA gives unprecedented access to the agency’s HQ and, for the first time, explains what it does and what it says it doesn’t do: spy on Americans Inside the NSA ~~~ The Snowden Affair ~~~ How did 60 Minutes get cameras into a spy agency? ~~~ |


| You are subscribed to email updates from The Big Picture To stop receiving these emails, you may unsubscribe now. | Email delivery powered by Google |
| Google Inc., 20 West Kinzie, Chicago IL USA 60610 | |


0 comments:
Post a Comment