


The Big Picture |
- Expectations Stay Anchored in Spite of Declining Inflation
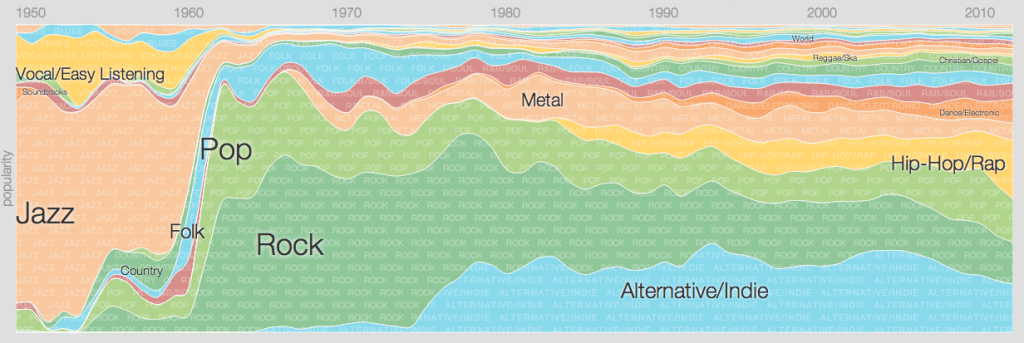
- Google’s Interactive Music Timeline
- Succinct Summation of Weeks Events (1.24.13)
- Comedians in Cars Getting Coffee with Jay Leno
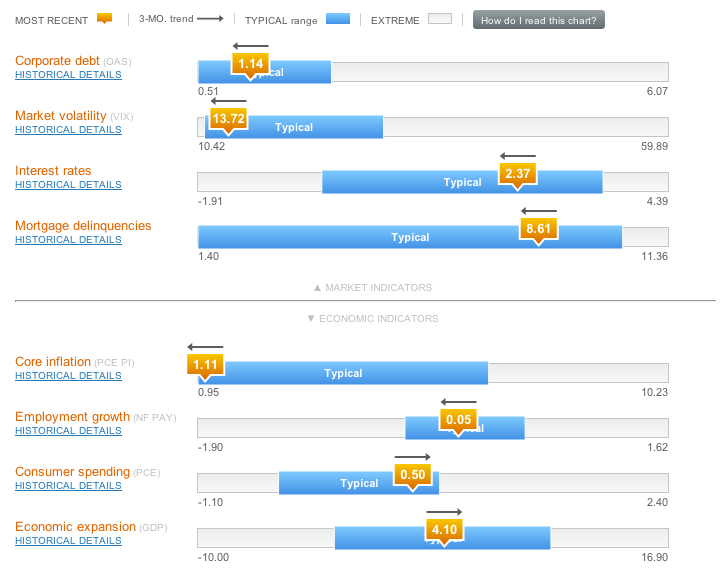
- Economic Indicators Dashboard
- 10 Friday AM Reads
- Look Out Below, Follow Through Edition
- Blue Ferrari 275 GTB/4 (Paris auction)
| Expectations Stay Anchored in Spite of Declining Inflation Posted: 25 Jan 2014 02:00 AM PST Expectations Stay Anchored in Spite of Declining InflationCharles T. Carlstrom and Margaret Jacobson The Federal Open Market Committee (FOMC) has stated that its long-run target for inflation is 2 percent. Inflation does and will always vary around that target, but some observers are worried that the recent decline we have seen in inflation is especially troublesome because the federal funds rate is essentially zero. The worry is that with what is basically the economy's short-term interest rate at zero, declines in inflation will cause one-for-one increases in the real interest rate (the after-inflation cost of borrowing). As a result, a decrease in economic activity could push down prices, and real economic activity could suffer because of the increase in real interest rates. Though we have only limited information to go on, the decline in inflation is not likely to continue. While short-term inflation expectations have declined somewhat with the recent declines in inflation, longer-term inflation expectations have not drifted down to any meaningful extent, which should help mute ongoing declines in inflation.
Personal Consumption Expenditures (PCE) inflation was essentially zero in the fourth quarter of 2013, significantly under the FOMC's target. Throughout 2013, PCE inflation averaged about 1.0 percent, still below the 2 percent target. Meanwhile, core PCE inflation, which excludes the volatile energy and food components, averaged 1.1 percent for the first two months of the fourth quarter and over 2013 as well. While the FOMC is concerned about PCE inflation as a gauge of price stability, core PCE inflation is closely watched because there is some evidence that it predicts inflation over longer horizons better than total inflation.
Although the FOMC focuses on the PCE, the Consumer Price Index provides another useful measure of inflation. The CPI is constructed from the prices faced by the average consumer, and CPI inflation typically runs about 25 basis points higher than PCE inflation. The overall pattern in recent CPI inflation is quite similar to PCE inflation. CPI inflation in the fourth quarter was 0.9 percent, and core CPI inflation was approximately 1.6 percent. This is also what core CPI inflation averaged over the past year, though in the previous two years it averaged between 1.9 percent and 2.2 percent. Therefore, it too has shown a continual decline over the past two years.
An interesting feature of both PCE and CPI inflation is the difference between the behaviors of inflation for service prices and goods prices. While the FOMC's objective is for total inflation, some people are particularly concerned about the dramatic decline in goods prices. For example, PCE core-goods-price inflation has been falling steadily, dropping from 1 percent in 2011 to −0.7 percent in 2013, while inflation in core PCE service prices has been almost perfectly flat for three years, hovering around 2 percent.
We see the same pattern with the CPI. Core service inflation has been nearly steady for two years at a tad above 2 percent. But over that time, core goods inflation fell sharply, dropping from an increase of 2.2 percent in 2011 to a decrease of 0.1 percent in 2013.
The decline in core goods inflation would be troublesome if core goods inflation predicted future inflation better than either core service or total core inflation. But arguably this is not the case. PCE service inflation is a better predictor of future inflation than goods inflation, while the evidence is mixed for the CPI. In the end, core (total) inflation is as good a predictor of both PCE or CPI inflation as goods or services inflation. Inflation Correlations, Quarters Ahead
Note: Correlations are calculated from 1967:Q2 to 2013:Q3. Another way of gauging whether or not the recent declines in inflation are a problem is to look at the long-term inflation outlooks of Blue Chip forecasters. Although their forecasts for near-term inflation have fallen a bit, the decrease seems to be transitory. While their prediction for inflation in the first quarter of 2014 is now ½ percentage point lower than they predicted in October, their forecasts for the second quarter of 2014 and onward have largely stayed the same.
Longer-term inflation forecasts, as measured through TIPS (Treasury inflation-protected securities), were basically unaffected by the FOMC's (surprising) December decision to taper asset purchases. Both 5- and 10-year forecasted rates show an insignificant decrease of around 2 basis points.
While there is uncertainty about short-term inflation, every indication is that longer-term inflation expectations remain anchored around 2 percent.
Source: Cleveland Fed | ||||||||||||||||||||||||||||
| Google’s Interactive Music Timeline Posted: 24 Jan 2014 04:30 PM PST | ||||||||||||||||||||||||||||
| Succinct Summation of Weeks Events (1.24.13) Posted: 24 Jan 2014 12:30 PM PST Succinct Summations week ending January 24, 2014 Positives:
Negatives:
| ||||||||||||||||||||||||||||
| Comedians in Cars Getting Coffee with Jay Leno Posted: 24 Jan 2014 09:30 AM PST
| ||||||||||||||||||||||||||||
| Posted: 24 Jan 2014 08:30 AM PST Click for an interactive graphic. | ||||||||||||||||||||||||||||
| Posted: 24 Jan 2014 06:15 AM PST Here is my Friday reading list to finish off your week:
| ||||||||||||||||||||||||||||
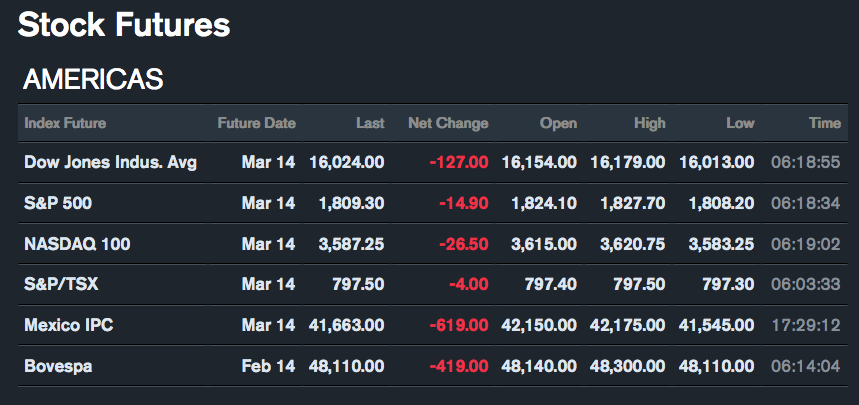
| Look Out Below, Follow Through Edition Posted: 24 Jan 2014 05:30 AM PST click for updated futures
Yesterday, we discussed the likelihood of an equity correction versus the end of the bull market. Today, futures are deep in the red, looking like another 1 percent sell-off or worse awaits us. European stocks are down 1 percent or more, with the IBEX off more than 2 percent. In Asia, it is a 2 percent whackage, although China has (so far) managed to hold on to small gains. Perhaps on this philosophical Friday, it might be a good time to wonder aloud as to the causes of this change in fortunes. Why the sudden shift, from excess bullishness and exuberant expectations of more double-digit gains, to a recognition that perhaps the party won't go on forever? You humans seem to desperately search for a simple narrative that explains complex events of unknown causation. An explanatory need not be accurate, only understandable and comforting. This is inherent in a species that has a rich tradition of storytelling. The narrative trumps data almost all of the time. The price action and misbehaviors of markets are certainly no different. Hence, a correction is not simply the random meanderings of a complex system comprised of the buying and selling activities of millions of participants, but rather must have been caused by stocks that were too pricey, or earnings that have not lived up to expectations, or the development of big trouble in China. The problem with these rationalizations is that all of these things were well understood by markets — and have been for some time. None are surprises, and none reflect information that is new or was especially unknown previously. | ||||||||||||||||||||||||||||
| Blue Ferrari 275 GTB/4 (Paris auction) Posted: 24 Jan 2014 03:00 AM PST | ||||||||||||||||||||||||||||


| You are subscribed to email updates from The Big Picture To stop receiving these emails, you may unsubscribe now. | Email delivery powered by Google |
| Google Inc., 20 West Kinzie, Chicago IL USA 60610 | |


0 comments:
Post a Comment