


The Big Picture |
- Commercial Credit Crisis of 1763 and Today’s Tri-Party Repo Market
- How Easy Is It to Buy a Drone?
- My motto: ‘Fresh mistakes, every year’
- 10 Weekend Reads
- Kiron Sarkar’s Weekly Report
| Commercial Credit Crisis of 1763 and Today’s Tri-Party Repo Market Posted: 16 Feb 2014 02:00 AM PST Crisis Chronicles: The Commercial Credit Crisis of 1763 and Today's Tri-Party Repo Market
During the economic boom and credit expansion that followed the Seven Years' War (1756-63), Berlin was the equivalent of an emerging market, Amsterdam's merchant bankers were the primary sources of credit, and the Hamburg banking houses served as intermediaries between the two. But some Amsterdam merchant bankers were leveraged far beyond their capacity. When a speculative grain deal went bad, the banks discovered that there were limits to how much risk could be effectively hedged. In this issue of Crisis Chronicles, we review how "fire sales" drove systemic risk in funding markets some 250 years ago and explain why this could still happen in today's tri-party repo market. Early Credit Wrappers One of the primary financial credit instruments of the 1760s was the bill of exchange—essentially a written order to pay a fixed sum of money at a future date. Early forms of bills of exchange date back to eighth-century China; the instrument was later adopted by Arab merchants to facilitate trade, and then spread throughout Europe. Bills of exchange were originally designed as short-term contracts but gradually became heavily used for long-term borrowing. They were typically rolled over and became de facto short-term loans to finance longer-term projects, creating a classic balance sheet maturity mismatch. At that time, bills of exchange could be re-sold, with each seller serving as a signatory to the bill and, by implication, insuring the buyer of the bill against default. This practice prevented the circulation of low-credit-quality bills among market participants and created a kind of "credit wrapper"—a guarantee for the specific loan—by making all signatories jointly liable for a particular bill. In addition, low acceptance fees—the fees paid to market participants for taking on the obligation to pay the bill of exchange—implied a perceived negligible risk. But the practice also resulted in binding market participants together through their balance sheets: one bank might have a receivable asset and a payable liability for the same bill of exchange, even when no goods were traded. By the end of the Seven Years' War in 1763, high leverage and balance sheet interconnectedness left merchant bankers highly vulnerable to any slowdown in credit availability.Tight Credit Markets Lead to Distressed Sales Merchant bankers believed that their balance sheet growth and leverage were hedged through offsetting claims and liabilities. And while some of the more conservative Dutch bankers were cautious in growing their wartime business, others expanded quickly. One of the faster growing merchant banks belonged to the de Neufville brothers, who speculated in depreciating currencies and endorsed a large number of bills of exchange. Noting their success (if only in the short term), other merchant bankers followed suit. The crisis was triggered when the brothers entered into a speculative deal to buy grain from the Russian army as it left Poland. But with the war's end, previously elevated grain prices collapsed by more than 75 percent, and the price decline began to depress other prices. As asset prices fell, it became increasingly difficult to get new loans to roll over existing debt. Tight credit markets led to distressed sales and further price declines. As credit markets dried up, merchant bankers began to suffer direct losses when their counterparties went bankrupt.The crisis came to a head in Amsterdam in late July 1763 when the banking houses of Aron Joseph & Co and de Neufville failed, despite a collective action to save them. Their failure caused the de Neufville house's creditors around Amsterdam to default. Two weeks later, Hamburg saw a wave of bank collapses, which in turn led to a new wave of failures in Amsterdam and pressure in Berlin. In all, there were more than 100 bank failures, mostly in Hamburg.An Early Crisis-Driven Bailout The commercial crisis in Berlin was severe, with the manufacturer, merchant, and banker Johann Ernst Gotzkowsky at the center. Gotzkowsky's liabilities were almost all in bills of exchange, while almost all his assets were in fixed capital divided among his silk works and porcelain factory. Berlin was able to mitigate the effects of the crisis when Crown Prince Frederick imposed a payments standstill for several firms. To prevent contagion, the prince also organized some of the first financial-crisis-driven bailouts after he examined the books of Gotzkowsky's diverse operations. Ultimately, about half of Gotzkowsky's creditors accepted 50 cents on the dollar for outstanding debts. Meanwhile, banks in Hamburg and the Exchange Bank of Amsterdam tried to extend securitized loans to deflect the crisis. But existing lending provisions restricted the ratio of bank money to gold and silver such that the banks had no real power to expand credit. These healthy banks were legally limited in their ability to support the credit-constrained banks. To preserve cash on hand, Hamburg and Amsterdam banks were slow to honor bills of exchange, eventually honoring them only after pressure from Berlin. The fact that Amsterdam and Hamburg banks re-opened within the year—and some even within weeks—provides evidence that the crisis was one of liquidity and not fundamental insolvency. The crisis led to a period of falling industrial production and credit stagnation in northern Europe, with the recession being both deep and long-lasting in Prussia. These developments prompted a second wave of bankruptcies in 1766. Distressed Fire Sales and the Tri-Party Repo Market As we saw during the recent financial crisis, the tri-party repo market was overly reliant on massive extensions of intraday credit, driven by the timing between the daily unwind and renewal of repo transactions. Estimates suggest that by 2007, the repo market had grown to $10 trillion—the same order of magnitude as the total assets in the U.S. commercial banking sector—and intraday credit to any particular broker/dealer might approach $100 billion. And as in the commercial crisis of 1763, risk was underpriced with low repo "haircuts"—a haircut being a demand by a depositor for collateral valued higher than the value of the deposit. Much of the work to address intraday credit risk in the repo market will be complete by year-end 2014, when intraday credit will have been reduced from 100 percent to about 10 percent. But as New York Fed President William C. Dudley noted in his recent introductory remarks at the conference "Fire Sales" as a Driver of Systemic Risk, "current reforms do not address the risk that a dealer's loss of access to tri-party repo funding could precipitate destabilizing asset fire sales." For example, in a time of market stress, when margin calls and mark-to-market losses constrain liquidity, firms are forced to deleverage. As recently pointed out by our New York Fed colleagues, deleveraging could impact other market participants and market sectors in current times, just as it did in 1763. Crown Prince Frederick provided a short-term solution in 1763, but as we'll see in upcoming posts, credit crises persisted. As we look toward a tri-party repo market structure that is more resilient to "destabilizing asset fire sales" and that prices risk more accurately, we ask, can industry provide the leadership needed to ensure that credit crises don't persist? Or will regulators need to step in and play a firmer role to discipline dealers that borrow short-term from money market fund lenders and draw on the intraday credit provided by clearing banks? Tell us what you think. Disclaimer
|
| How Easy Is It to Buy a Drone? Posted: 15 Feb 2014 02:30 PM PST Businesses can’t wait for drone rules to be issued by the FAA. They really can’t. Estimates on business drone usage are in the tens of thousands…and they’re overwhelming the FAA, which is still trying to come up with rules for flying them. Megan Hughes has more on the unregulated drone boom.
|
| My motto: ‘Fresh mistakes, every year’ Posted: 15 Feb 2014 07:00 AM PST My motto: 'Fresh mistakes, every year'
Once again, it is the time of year where I look back at the various investing, trading and other mistakes I've made. (Last year's version is here; prior years can be found here). Why go through this annual review of blunders? Rather than engage in the sort of selective retention that so many investors tend to do and pretend mistakes never happened, I prefer to "own" them. This allows me to learn from them, and with any luck avoid making the same errors again. My motto: "Fresh mistakes, every year." It also provides a good opportunity for humility — a reminder of how little we actually know, and how much our expectations about the future are often at odds with what actually occurs. Ray Dalio, who runs the world's largest hedge fund, observes this is how we "live up to our potential" as investors. The alternative is continually lying to oneself — about how smart we can be, how insightful our worldview is and what great investors we are. I am reminded of an old Yiddish expression: "Man plans, and God laughs." Last year, I got quite a few things right. But as always, I was regularly — and, on occasion, spectacularly — wrong. That is par for the course. Here's how I fared: 1 Emerging markets look cheap. There are a variety of ways to measure how expensive equities are. Yale Professor Robert Shiller's CAPE valuation method was very popular last year. Shiller, who received the 2013 Nobel Prize in Economic Sciences, looks at 10 years of earnings in order to adjust for the ups and downs of the business cycle. By this metric, U.S. markets were a bit pricey, while Europe was moderately cheap, and emerging markets were even cheaper. Out of 40 major countries, the United States was the fourth-most expensive (36th cheapest) and Greece had the cheapest market. Russia was fourth cheapest, while Brazil was the 10th cheapest. How did that work out in 2013? Here in the United States, the S&P 500-stock index had a total return of about 32 percent. Meanwhile, "cheap" markets, such as the broad MSCI Emerging Markets Index, fell about 10 percent. And when we look at specific countries, it was even worse, with Russia down 3.5 percent, Brazil lost 15 percent — and Greece was up 27 percent. The saving grace of this is that emerging markets are less than 10 percent of the benchmark All Country World Index. These markets shaved about 1 percent off of our global equity portfolios. 2 AIG repays its $182 billion bailout.* In 2010, I described the possibility of AIG ever repaying the government for the $182 billion bailout as "highly unlikely." I also described it as a "shell game" and wondered how the management of the bankrupt insurer would ever be able to sell off enough pieces of the company to repay the government. I have repeatedly said the same in public ever since. According to the Treasury Department, AIG paid back a total $205 billion — more than the original bailout — thereby making a profit and proving me wrong. Even Pro Publica, which has been tracking all of the bailout disbursements, credits AIG with a $5.03 billion profit. Why the asterisk? Well, like the steroid era in baseball, this one had to use a little juicing to get there. As part of the repayment process, AIG asked Treasury for — and got — a special tax dispensation for "net operating losses" worth an estimated $25 billion to the company. Before your eyes start to glaze over, a brief explanation: Whenever a company suffers a big loss, it normally gets to carry it forward. The big exceptions to this are either bankruptcy or a change in ownership. AIG had both, so it really should not have gotten the tax benefit of its massive losses. Essentially, Treasury said to AIG: "Here's a $25 billion tax break — please use it to pay us back our money so we can claim to have made money on the deal." Oh, and normally, that is something that should really be authorized by Congress, not the executive branch. But let's be blunt: I never expected AIG to come anywhere close to paying back $182 billion. I was wrong. That it did just goes to show you how good its underlying insurance business was before AIG inadvertently destroyed it via adventures in derivatives. 3 Thinking about crashes and corrections.Throughout 2013, there was a steady drumbeat of warnings of an imminent crash. Comparisons were made to 1929 and 1987, with overlaid charts that "proved" we were doomed. The crash warnings were coming mostly from people who had been repeating them for years while missing an enormous rally. None of the technical signs that accompany market tops was present, making these easy to ignore. On the other hand, the typical year sees about three stock corrections of 5 percent ormore. We had one. Although it didn't affect how we invested our capital, I feel like I spent an inordinate amount of time thinking about the risk of imminent corrections. Solution: We should be primarily concerned about things within our control. Markets correct, volatility happens. The key takeaway is to stay focused on what is within your ability to manage — our portfolio allocation, how much we contribute toward retirement, how much debt we accumulate. Time spent on things beyond our control is wasted. 4 Hating Microsoft. I have been a member of the Microsoft-bashing society for quite some time. Last fall, I penned my explanation for what's behind Microsoft's fall from dominance. In the past, I have even gone so far as to blame it for causing the dot-com bubble. And I savaged the leadership of Steve Ballmer, who oversaw a rather moribund period at Microsoft. Perhaps I buried Microsoft prematurely, based on developments of the past week: A new CEO who seems very savvy with great tech credentials; the return of Bill Gates as chief technology adviser; and the push into subscription-based software sales. Microsoft seems to be gaining traction, and even its stock price is looking up. 5 Too much junk, not enough books. 2013 was the first year I read fewer than 10 books in a long while. Maybe it was because I was too busy with work (we launched a new firm) or too distracted with Twitter. Regardless, my usual voracious book consumption suffered. Even worse, I read a lot of meaningless news stories, gossip, blogposts and filler. The silver lining is it led me to write two columns: "Reduce the noise levels in your investment process," followed by "Use the news: How to get the most out of financial media." Now I have to follow my own advice. The solution is simple: Return to reading at least one (and ideally two) books a month. 6 Don't feed the trolls. Speaking of wasting time, one of the biggest mistakes I made last year was engaging in useless online debate with hacks, twerps and trolls. On Twitter, I wasted time with creationists; online, I debated global warming denialists. Even worse, I know better. I came up with one of the most anti-troll comment policies even invented. The solution is to ignore the online knuckleheads who do not add anything positive to the discussion. On Twitter, reduce the number of people I am following. Block anyone creepy — including haters, people who do not believe in science and anyone whose contributions are negative. And stay out of the comments section! Those are my errors for 2013. What mistakes did you make last year? Ritholtz is chief investment officer of Ritholtz Wealth Management. He is the author of "Bailout Nation" and runs a finance blog, the Big Picture. Twitter: @Ritholtz. |
| Posted: 15 Feb 2014 05:00 AM PST My before-I-take-off-for-vacation longer form weekend reading:
What’s up for this week?
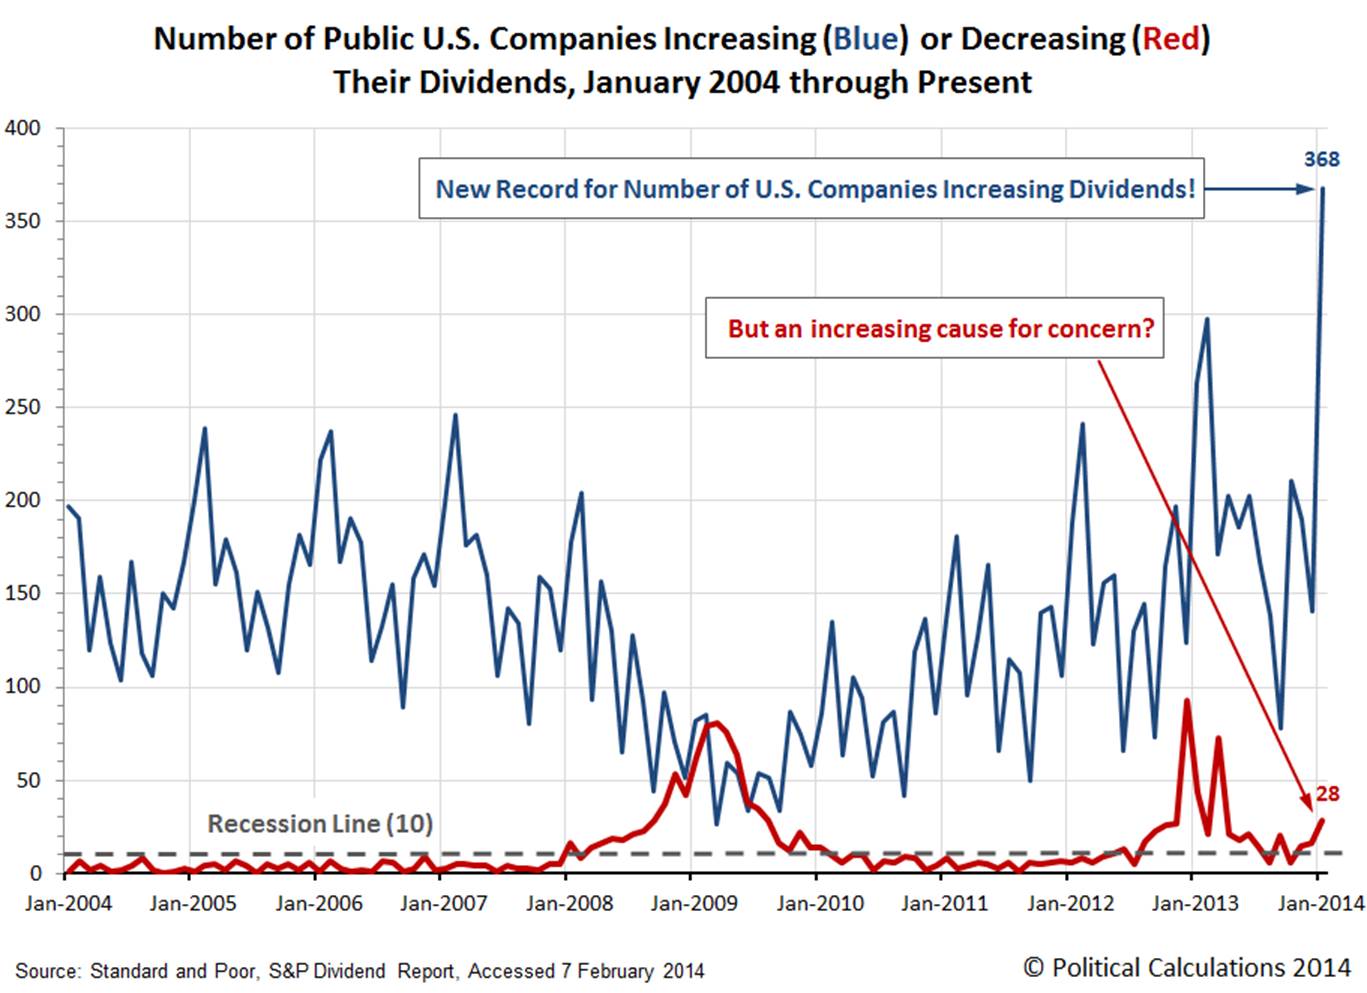
Number of Public U.S. Companies Increasing (Blue) and Decreasing (Red) Their Dividends, January 2004 Through Present |
| Posted: 15 Feb 2014 03:00 AM PST Overview Markets have rallied, inter alia, on dovish comments by Mrs Yellen and better(?) Chinese data, with the VIX declining and the US 10 year bond yield back up to 2.73%, though off its highs. However, the reality is that Chinese growth is much less than reported officially and credit risks remain prominent. The Japanese experiment is fraught with problems and with the country facing a current account deficit this year, investors are likely to reconsider the merits of the country and the Yen. Yes, EZ GDP is better, but disinflationary pressures persist and the regions banks are certain to require significant capital to meet the upcoming stress tests. Certainly, it looks as if US interest rates will remain lower for longer. However, as Credit Suisse puts it, equities seem to be the default investment of choice, given the lack of alternatives. That may be so, but markets in developed economies are not cheap and risks are rising. Admittedly, most analysts expect single digit returns from developed market equities this year, though I remain sceptical. As the FED continues with its tapering programme, emerging markets are likely to face continued pressure and I remain bearish across all EM asset classes, namely equities, bonds and currencies. In terms of currencies, Sterling outperformed. The testimony by the Governor, Mr Mark Carney suggests that UK interest rates will rise in Q1/Q2 2015, making the UK the 1st of the major developed countries to raise rates. The US$ was marginally lower across most currency pairs on weaker data and a dovish Mrs Yellen. The Yen strengthened as their stock market declined and investors remain cautious on emerging markets. Whilst this may continue for a while, the prospect of, inter alia, current account deficits in 2014 suggests to me that the Yen will depreciate further. The A$ strengthened on better? Chinese data and the statement that the RBA would be on hold in terms of interest rates. However, I believe the trend remains for a weaker A$. Once again, I believe that the US$ will outperform this year. The Euro rose from its lows, but I believe there is a strong possibility that the ECB will cut interest rates next month. I remain bearish on equity markets generally given the risks and believe that markets are likely to correct at which time, investors can consider their options. US The FED Chair, Mrs Yellen reiterated the FED's dovish stance and pledged to continue with the previous policy. She stated that monetary accommodation would remain in place well after both the asset purchase programme had ended and the unemployment rate declined to 6.5% and that the FED would look at other data when evaluating the labour market, forward guidance and its overall monetary policy. She added that the recovery in the labour market was far from complete. Her remarks suggested that the FED's tapering programme would continue and repeated that the FED was mandated to focus on the US, rather than other countries - a response that EM's would have to look after their own interests. Essentially, there were no real surprises in her remarks. However, her dovish comments helped US markets. The US Congress voted to increase the US debt ceiling unconditionally until March next year. The Senate also approved the increase. US weekly jobless claims rose by 6k to 339k, higher than the 330k expected. US retail sales declined by -0.4% in January, the most in 10 months and worse than the unchanged figure expected. December was revised lower to a decline of -0.1%, from a previously reported rise of +0.2%. November was also revised down. The bad weather could have impacted, but the number remains weak. The data suggests that Q4 GDP will have to be revised lower, to around +2.7%, from the +3.2% previously reported. In addition Q1 GDP is likely to come in around 2.0%, or even lower. Import prices rose by +0.1%, as opposed to the decline of -0.1% expected. Y/Y, import prices declined by -1.5%, though less than the decline of -1.8% expected. US industrial production was -0.3% lower in January, as opposed to the rise of +0.3% expected. Manufacturing declined by -0.8%, as opposed to the rise of +0.1% expected and the downwardly revised increase of +0.3% the previous month. US consumer sentiment rose to 81.2 in February, unchanged from January, though better than the decline to 80.2 expected. The expectations component rose to 73.0, from 71.2. Europe The EZ's chief banking regulator Ms Nouy has suggested that banks would have to be closed down if they fail the stress tests and cannot raise the capital necessary. Ms Nouy added that the link between banks and the sovereigns, which has been the problem, must be severed. Tough talk – it’s likely that some EZ banks will indeed have to be wound up. The French national auditor warned that France will miss its budget deficit target of 4.1% for 2013 and that the 3.6% forecast for this year was "not at this point guaranteed". Furthermore, the auditor warned that France risked losing its financial credibility. France had pledged that it would reduce its deficit to 3.0% in 2015, which has already been delayed by 2 years. Frances debt to GDP is set to exceed 95% this year. German CPI declined by -0.6% in January, as opposed to the increase of +0.4% in December. The ECB has dismissed the idea of significant and persistent disinflation, but the numbers speak for themselves. Political turmoil continues in Italy. The PM, Mr Letta has resigned. New elections are unlikely and Mr Renzi, the head of Italy’s largest party is likely to take over as PM. His policies are essentially the same as that of Mr Letta's. If Mr Renzi does take over, it will be Italy's 3rd unelected government in just 2 years. Some positive news for the EZ. The economic sentiment index, the Sentix index, rose to 13.3, from 11.9 in January. The economic expectations component rose to the highest level since February 2006. The EZ Q4 GDP increased by +0.3% (+1.1% on an annualised basis), higher than the rise of +0.2% expected and as compared with the growth of +0.1% in Q3. German GDP rose by +0.4%, with French GDP up by +0.3%, both beating expectations. Indeed, there was a risk that France would post negative growth in Q4. France's previous Q's GDP was revised higher to unchanged from -0.1%. Italy posted a rise of +0.1%, the 1st positive growth since Q2 2011. The Italian economy contracted by -1.9% last year. Only Greece reported negative growth. Whilst not great, certainly better than expected growth from the major EZ countries. Moody's rated the outlook on Italy's bond rating to stable from negative – a surprise I must say. The British Retail Consortium reported that retail sales rose by a massive +3.9% Y/Y in January, well above the +0.8% expected and the small rise of just 0.4% in December. Sterling appreciated on the news. The Governor of the Bank of England (BoE) reiterated that the BoE would keep interest rates unchanged and adjusted the forward guidance criteria. He added that the BoE would not raise rates until employment, incomes and spending were growing "at sustainable rates". The previous guidance that rates would remain low until unemployment fell to 7.0% is likely to be met this Q, according to the BoE. Mr Carney accepted that a rate rise in H1 2015 was possible, clearly positive for Sterling. Japan Core machinery orders collapsed by -15.7% in December, much worse than the decline of -4.0% expected, with growth at just +6.7% Y/Y. It was the worst decline since 1998. Companies are cautious ahead of the sales tax rise in April. This kind of data just reconfirms my view that Abenomics and the BoJ's policy will not work. Japanese wholesale prices rose by +2.4% Y/Y, mainly to to higher import prices as the Yen has weakened. The Japanese stock market has been the worst developed economy market this year. However, the decline in the stock markets has resulted in a rally in bonds with the 10 year yielding just 0.59%, well below prevailing inflation. I just wonder how much longer the bond market can yield these very low levels, though 3 year future inflation swap rates do indicate that inflation will decline to around 0.4% from February 2016, according to Bloomberg. China The Chinese Central Bank warned that volatility in money market rates will continue and that interest rates will rise. The PBoC has been trying to curb excessive credit growth and it is clear that the PBoC intends to tighten monetary policy. The PBoC also warned of the risks relating to local government finances. The reduction in financing, whilst necessary, will negatively impact economic growth. Chinese January official data rose by 10.6% in January, well above the unchanged level expected. Imports rose by +10.0%, with the trade surplus coming in at US$31.9bn. Once again, I would treat these numbers particularly cautiously, as the data is impacted by capital inflows which are recorded as exports. Indeed, data from neighbouring countries do not tie up with the Chinese trade data. China's inflation (CPI) came in at +2.5% Y/Y, the same as December. However the producer prices continued to decline with prices down by -1.6% Y/Y, worse than the decline of -1.4% in December and the 23rd consecutive monthly decline, extending the longest series of declines since the 1990's. Forecast GDP growth of +7.5% this year looks impossible, even if you believe the official data. There are possible further problems relating to the so called wealth management products to the coal sector. This issue is going to be a major problem for the Chinese authorities and one which is extremely large in size. The amount invested in wealth management products is estimated at US$ 1.7tr in total, around 1/3rd of which is due for repayment this year, according to the FT. Other |
| You are subscribed to email updates from The Big Picture To stop receiving these emails, you may unsubscribe now. | Email delivery powered by Google |
| Google Inc., 20 West Kinzie, Chicago IL USA 60610 | |


0 comments:
Post a Comment