


The Big Picture |
- Demographic Trends and Growth in Japan and the United States
- Yesterday’s Bear Column on BBRG Home Page
- 10 Thursday PM Reads
- AAII Presentation: Brain on Stocks
- Fugly!
- Predict This!
- 10 Thursday AM Reads
- Map of Top 20 Billionaire Cities
| Demographic Trends and Growth in Japan and the United States Posted: 10 Oct 2014 02:00 AM PDT Demographic Trends and Growth in Japan and the United States
The United States and Japan are experiencing very different population trends. Organisation for Economic Co-operation and Development (OECD) data show that the U.S. population has increased 12 percent since 2000, while Japan's population has fallen back to near where it was that year. The more striking development is that the working-age population in Japan is down 9 percent since 2000 while it is up 12 percent in the United States. As a consequence, the population share of those 65 and over has increased from 17 percent to 23 percent in Japan over this period while the U.S. share has increased from 12 percent to 14 percent. The difference in their labor forces, however, is narrower. (The labor force includes those with a job and those actively looking for work.) That is, the labor force is not falling as much as the working-age population in Japan and is not rising as much as that cohort in the United States. A breakdown of the labor force participation rate in the chart below (labor force divided by the corresponding population) for the working-age population shows very different trends in the two countries. In Japan, the working-age female labor participation rate has increased by 6 percentage points since 2000, with the size of the labor force increasing 2 percent even as the number of people in this cohort declined 9 percent. The corresponding female labor force participation rate fell in the United States, with the labor force rising 9 percent, which is slower than the 12 percent increase in the population of this cohort. The decline in U.S. male labor force participation was a bit greater, while the Japanese male participation rate has remained steady at a high level. Note that the large gap in the participation rate for women in the two countries that existed in 2000 has largely disappeared. The increase in Japan's female labor force participation and the decline in U.S. participation rates have moderated the economic impact of widely divergent demographic trends. While there is a 21 percentage point difference in changes in the working-age population since 2000 (+12 percent versus -9 percent), the difference in labor force growth is 12 percentage points (+9 percent versus -3 percent). The difference in employment growth shrinks even more to 9 percentage points (+6 percent versus -3 percent) as the U.S. unemployment rate is higher than it was in 2000 and Japan's rate is lower. The offsetting trends in labor force participation rates have helped minimized differences in per capita growth between the two countries since 2000. Over time, a country's growth is dictated by the quantity and quality of its labor and capital, along with it success in improving how workers and capital are used (total factor productivity). The moderation of differences in the labor force given the wildly different demographic trends has contributed to a very small gap in per capita GDP growth since 2000 for the two countries, as seen in the chart below. The 1990s was a decade of weak growth in Japan relative to that in the United States, but Japanese GDP adjusted for population growth has closely tracked that of the United States since then even as the U.S. economy grew more than twice as fast (25 percent versus 10 percent). The challenge for Japan is to sustain growth while the population continues to age. The United Nations (UN) estimates that the pace of the decline in Japan's working-age population is easing, but will still fall at an average rate of 0.9 percent per year from 2015 to 2020. In particular, there are limits to how much higher the female labor force participation rate can rise after increasing to near the U.S. rate. This will be an unrelenting challenge for the Japanese economy as the 65 and over cohort is set to rise steadily and will only peak in 2055 when this group is projected to be 37 percent of the population. The demographic trends are not nearly so dire in the United States, even with the aging of the baby-boom generation. The working age-population is still growing, with the UN projection of a 0.3 percent rate increase per year from 2015 to 2020. In addition, the aging is set to be much slower than in Japan, with the 65 and over cohort rising from 15 percent of the population to 22 percent by 2055, which will still be less than what it is in Japan today. Disclaimer
|
| Yesterday’s Bear Column on BBRG Home Page Posted: 09 Oct 2014 05:00 PM PDT Hey, this is pretty cool: Yesterday morning’s column on the Signs of a Bull Market Turning Bear made the home page of Bloomberg.com . . .
Click for bear column |
| Posted: 09 Oct 2014 01:30 PM PDT My afternoon train reads:
What are you reading?
Big Down Day Followed By Even Bigger Up Day
|
| AAII Presentation: Brain on Stocks Posted: 09 Oct 2014 11:30 AM PDT The ongoing battle between you and that large, mostly under-utilized slab of grey matter resting atop your spinal cord, doing very little of anything (except keeping you alive…)
AAII Brain on Stocks Presentsation NYC 2014
Downlaod: AAII NYC 2014
|
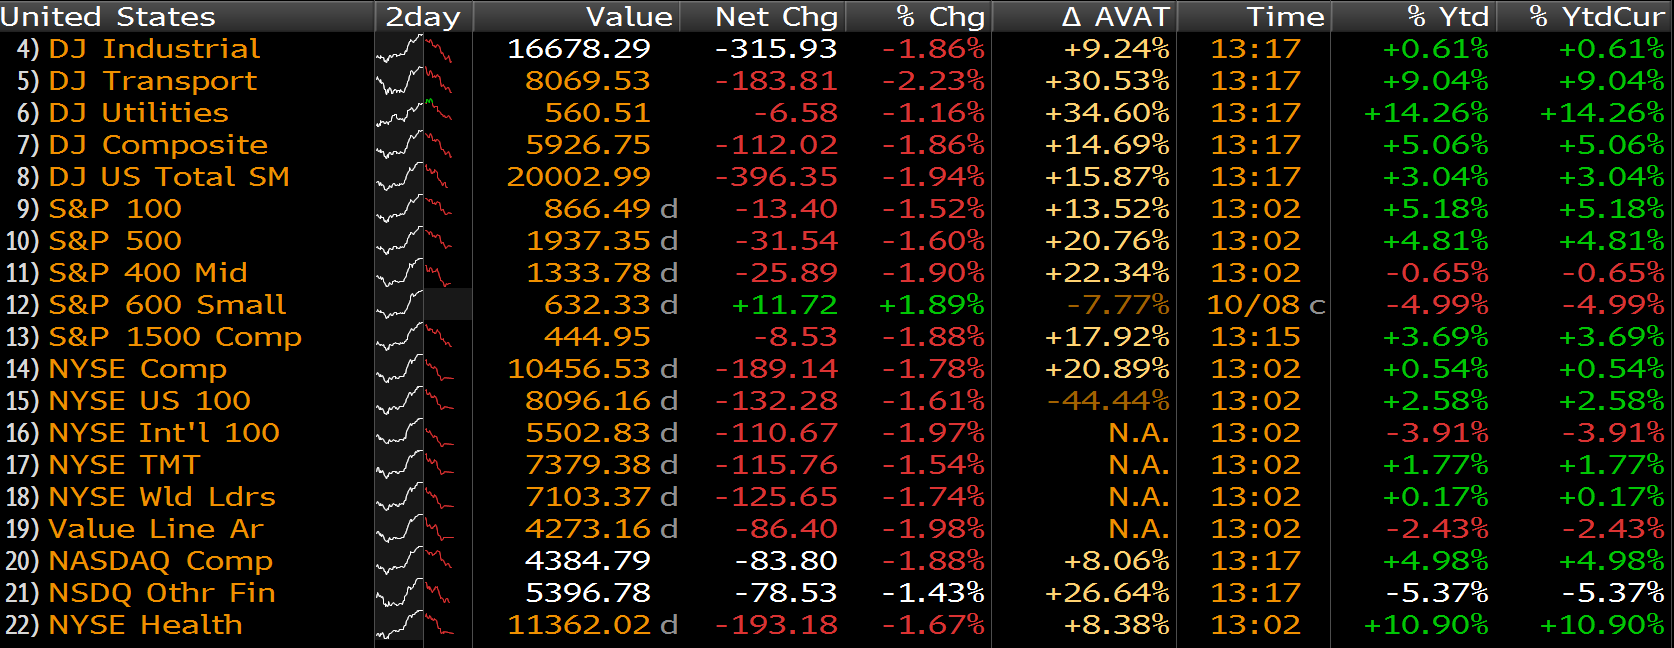
| Posted: 09 Oct 2014 10:20 AM PDT Lows of the day:
click for ginormous version |
| Posted: 09 Oct 2014 05:45 AM PDT Over the years, I have discussed how little I care for predictions (see “The Folly of Forecasts“). We have chatted about how poor Wall Street is at making forecasts, wondered why they keep at it and revealed the secret to making better predictions. But the bottom line is that you humans are terrible at forecasting the future. You are bad at predicting the economy and terrible at forecasting markets. The data shows you can’t even predict your own behavior. Which leads me to today's delightful quote, from Jason Shapiro of Perbak Futures Management. Shapiro observes just how wrong our forecasts about the future can get:
Truer words were never spoken. I recall referring to this chart from Morgan Stanley Europe at an event I was speaking at in the summer of 2009. I noted that following a 50 percent drop in the stock market, the median bear-market-rebound rally was a 70 percent bounce. The room exploded in laughter, as everyone knew that was never going to happen. Everyone knew the bounce off of the lows was a thing of the past. The forecasts were for Dow 5,000 (See Kostin, Gross and Nenner), Dow 3,000, (Denninger and Dent) and even Dow 1,000 (Prechter). |
| Posted: 09 Oct 2014 05:30 AM PDT I was busy yesterday afternoon, did anything interesting happen while I was out?
|
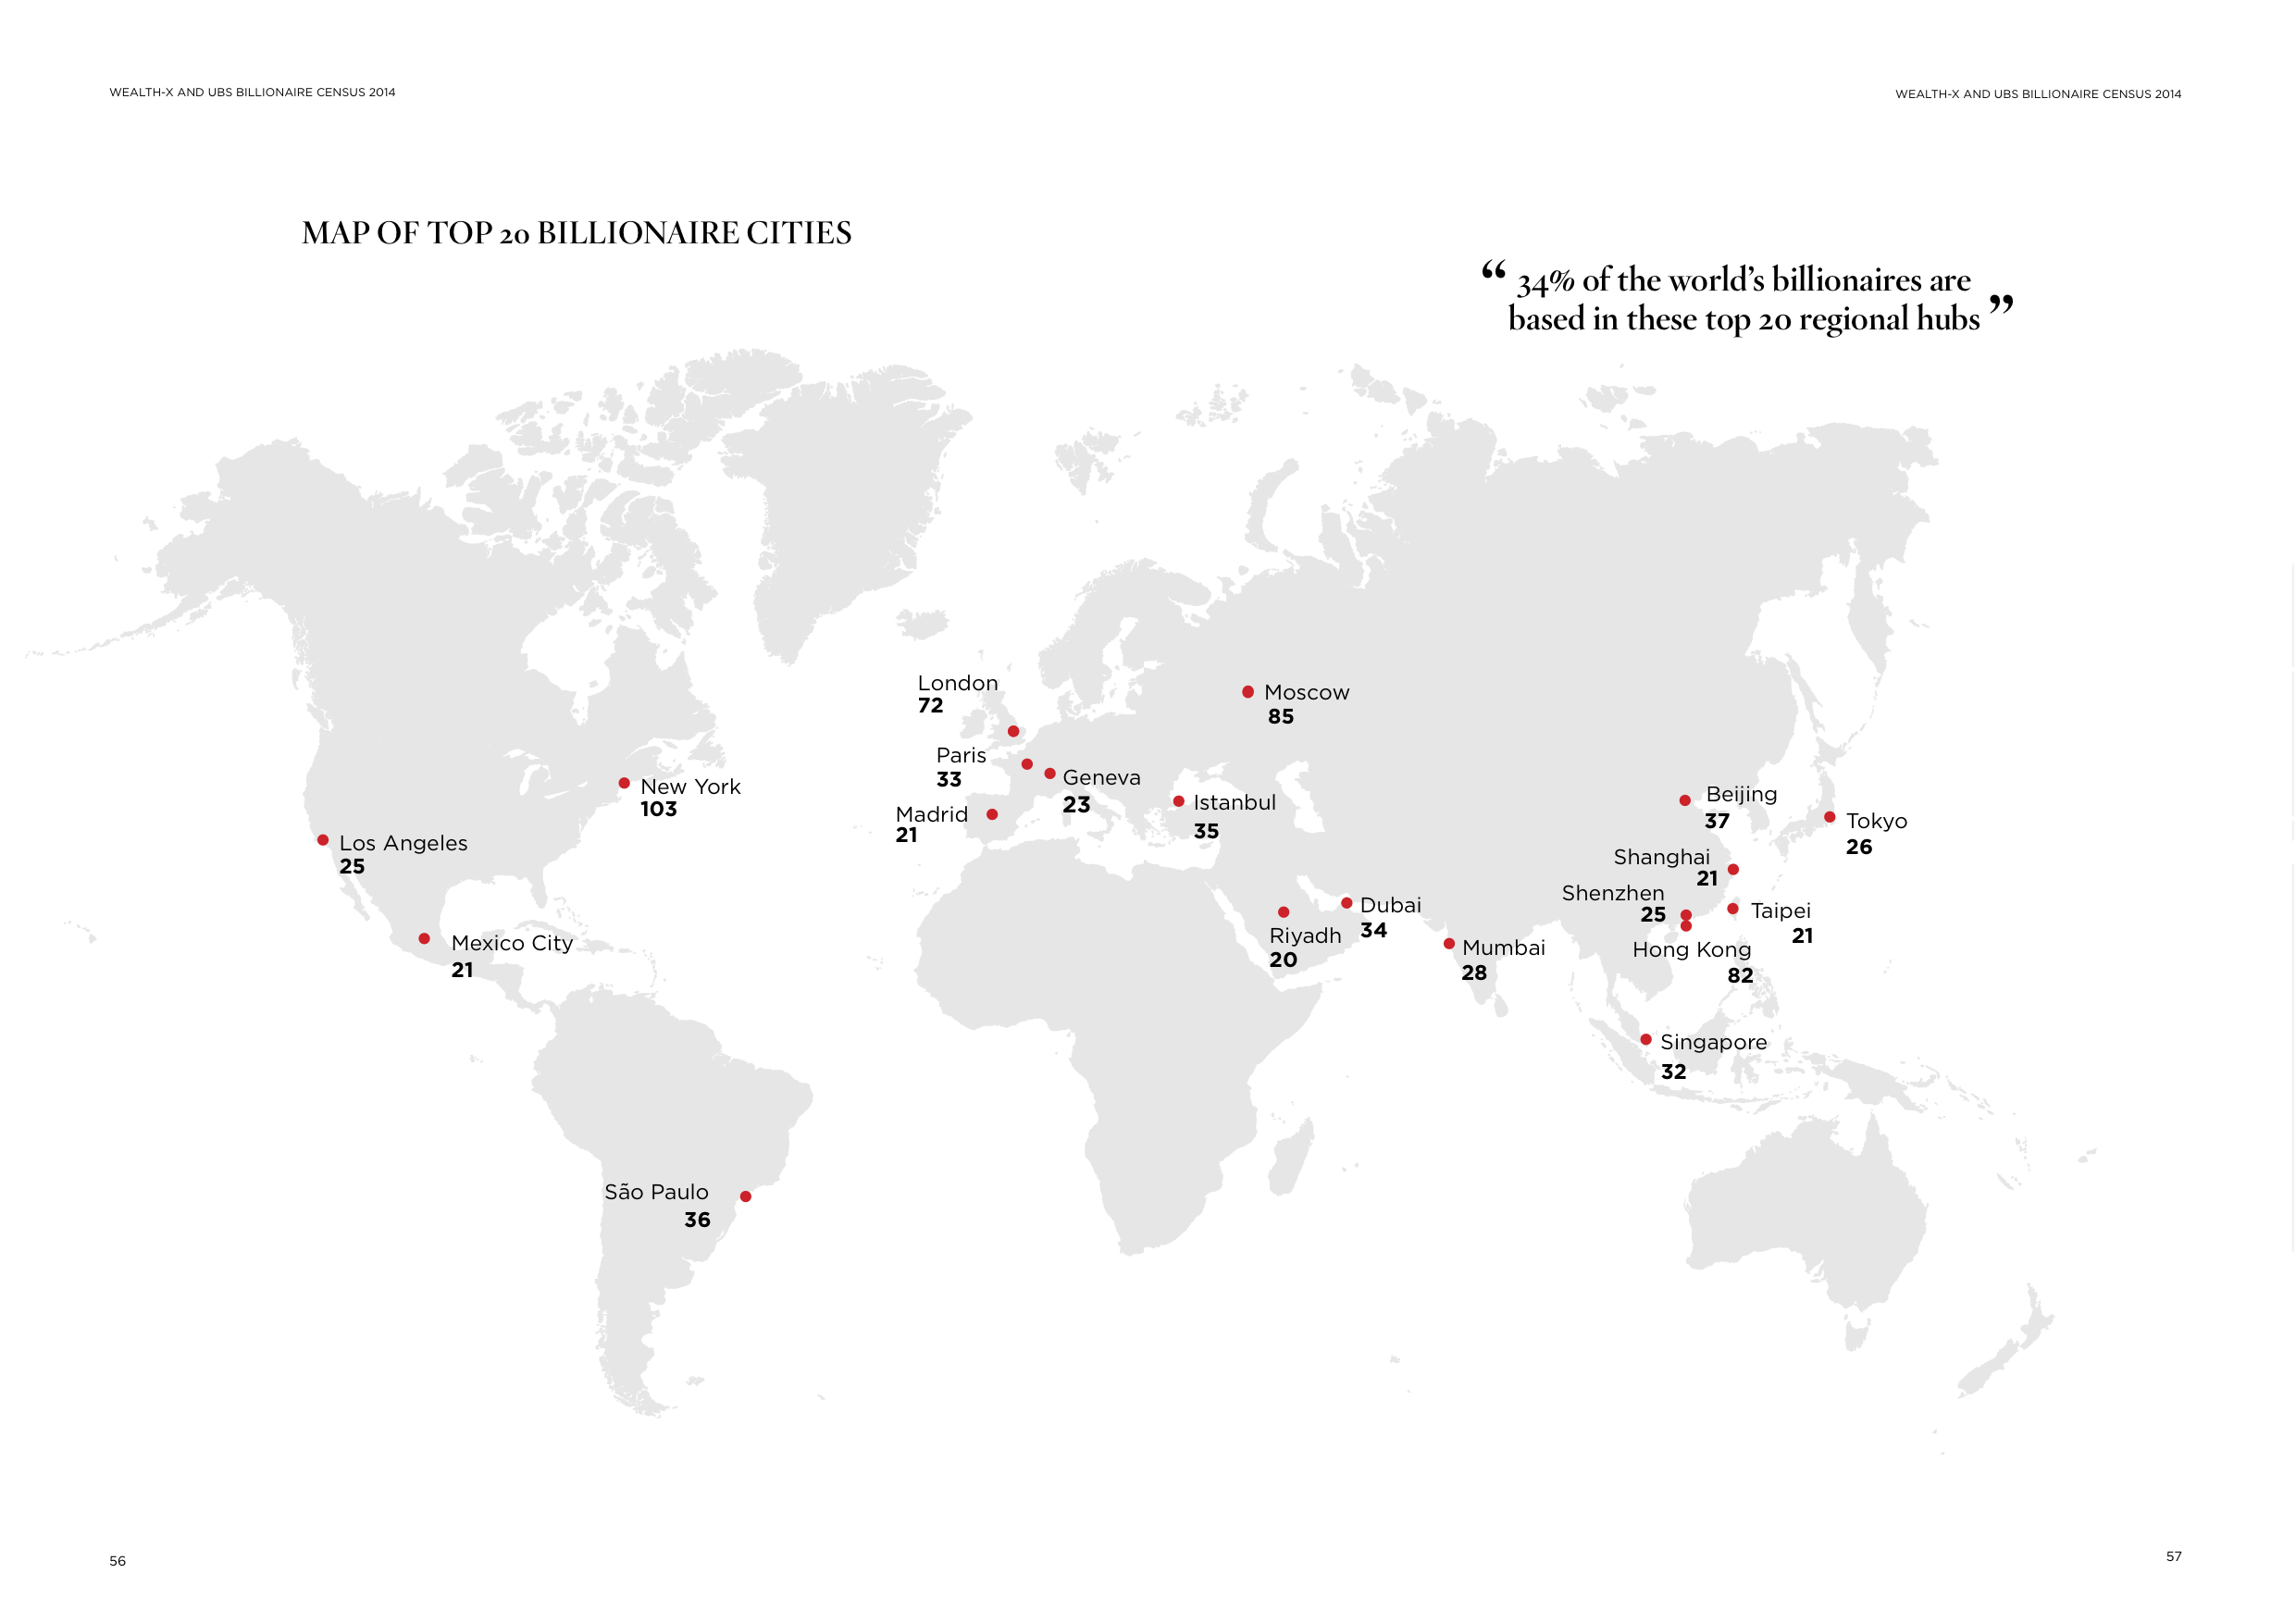
| Map of Top 20 Billionaire Cities Posted: 09 Oct 2014 04:00 AM PDT click for full report |


| You are subscribed to email updates from The Big Picture To stop receiving these emails, you may unsubscribe now. | Email delivery powered by Google |
| Google Inc., 20 West Kinzie, Chicago IL USA 60610 | |


0 comments:
Post a Comment