.

{2} GoogleTranslate (H)

English French German Spanish Italian Dutch Russian Portuguese Japanese Korean Arabic Chinese Simplified

Our New Stuff

{3} up AdBrite + eToro

Your Ad Here

Tuesday, May 21, 2013

The Big Picture

The Big Picture


The Geography of Student Debt

Posted: 21 May 2013 02:00 AM PDT

 The Geography of Student Debt
Andrew Haughwout, Donghoon Lee, Wilbert van der Klaauw, and Joelle Scally
May 14, 2013


This morning, the New York Fed released its Quarterly Report on Household Debt and Credit for 2013 Q1. The report uses the FRBNY Consumer Credit Panel to show that outstanding household debt declined approximately $110 billion (about 1 percent) from the previous quarter. The drop was due in large part to a reduction in housing-related debt and credit card balances. Meanwhile, delinquency rates for each form of consumer debt declined, with the overall ninety-plus day delinquency rate dropping from 6.3 percent to 6.0 percent.

One of the unique aspects of the FRBNY Consumer Credit Panel, which is itself based on Equifax credit data, is the detail we obtain for each kind of household debt. This quarter, we have taken advantage of the geographic information available in the data set and are introducing a set of maps of our student loan data, which indicate regional variation in several dimensions of student debt. They depict:

    • Student loan borrowers as a share of the population. The population with active student loan debts, or "SL borrowers," as a share of the population with a credit record varies substantially over space. For example, in Hawaii, less than 12 percent of people with a credit report have student debt, while in the District of Columbia over 25 percent do.
    • Student loan balances per SL borrower. Student indebtedness is significant for SL borrowers in virtually all states. Educational indebtedness per SL borrower ranges from a low of just under $21,000 in Wyoming to a high of over $28,000 in Maryland. Again, Washington, D.C., stands out: the average SL borrower there owes over $40,000. In general, we find SL-borrower debt levels are highest in California and along the Atlantic and Gulf coasts.
  • Percent of balance ninety-plus days delinquent. Delinquency rates show a distinct regional pattern, with states in the south and southwest having generally higher rates than those in the north. The lowest delinquency rate is South Dakota, at just over 6.5 percent, while the highest is in West Virginia, at nearly 18 percent.

    Student loan indebtedness and delinquency continue to generate intense interest and we look forward to sharing data and perspectives that help define the scope of this important issue.

Disclaimer
The views expressed in this post are those of the authors and do not necessarily reflect the position of the Federal Reserve Bank of New York or the Federal Reserve System. Any errors or omissions are the responsibility of the authors.


Haughwout_andrew
Andrew Haughwout is a vice president in the Research and Statistics Group.

Lee_donghoon
Donghoon Lee is a senior economist in the Group.

Scally_joelle
Joelle Scally is an economic analyst in the Group.

Van_der_klaauw_wilbert
Wilbert van der Klaauw is a senior vice president in the Group.

This is Why You Can’t Outrun a Cheetah

Posted: 21 May 2013 01:00 AM PDT

Source: Speed Kills

The United States of Conspiracy

Posted: 20 May 2013 04:30 PM PDT

click for complete infographic
weird america

The editors at Best Psychology Degrees decided to research the topic of:
The United States of Conspiracy

12 of the weirder things Americans believe.

- Barack Obama is the anti-Christ (13%)
- A “New World Order” is conspiring to rule the world (28%)
- The government covered up a UFO crash at Roswell in 1947 (21%)
- Bigfoot and Sasquach (14%)
- The moon landing was faked (7%)
- Paul McCartney died in 1966 and was replaced by a lookalike so The Beatles could continue (5%)
- The government adds fluoride to the water supply for sinister (not health) reasons (9%)
- Shape-shifting reptile people control the world (4%)
- Exhaust seen in the sky behind airplanes is actually chemicals sprayed by the government for sinister reasons (5%)
- The sun revolves around the earth (18%)
- The media or the government add secret mind-controlling technology to TV broadcast signals (15%)
- The number 13 brings bad luck (18%)


The United States of Conspiracy
Image compliments of Best Psychology Degrees


10 Monday PM Reads

Posted: 20 May 2013 01:30 PM PDT

My afternoon train reading:

• Boom or Bubble? (The New Yorker) but see Is This the Best Time for Investors? Don’t Bet On It. (WSJ)
• How Benjamin Graham Revolutionized Shareholder Activism (Echoes)
• Dear NYSE: Canceling Trades Destroys The Integrity of The Market (Kid Dynamite’s World)
• Telling the Truth on Fees, Warts and All (NYT) see also Making your financial adviser measure up (MarketWatch)
• Gross to Buffett Omens Disregarded as Sales Soar (Bloomberg)
• What's Holding Back Hiring? (Real Time Economics)
• Wall Street Deregulation Advances Despite Warnings Vote Could ‘Haunt’ Congress (HuffPo)
How much? Samsung swipes 95% of Android profits (Digital Trends)
• Tesla’s fight with America’s car dealers (CNN Money)
• 12 reasons X-Prize billionaires are cheapskates (MarketWatch)

What are you reading?


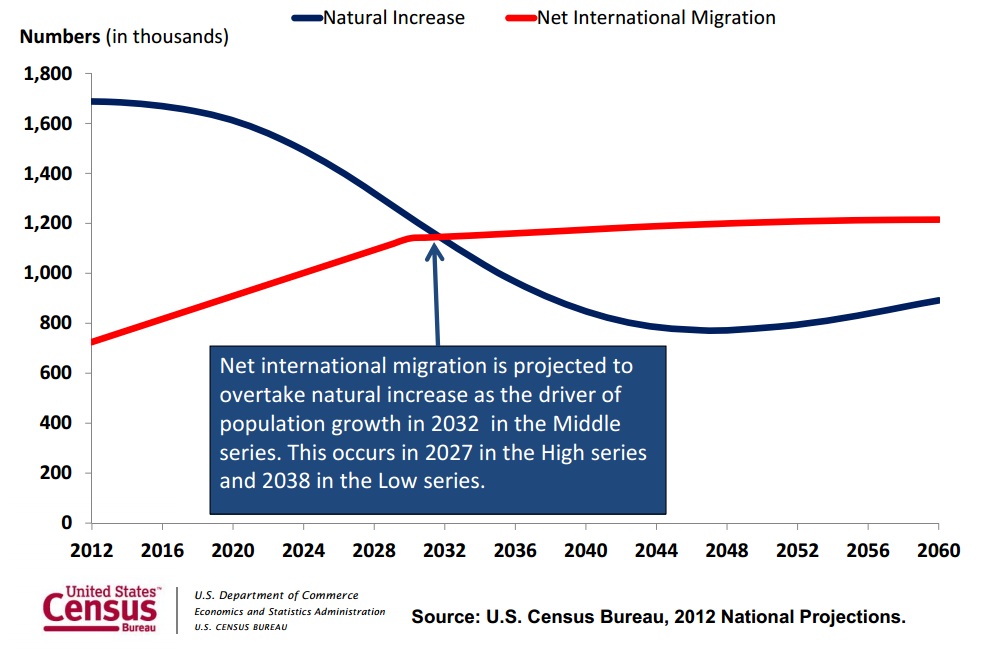
Where International Migration Passes Natural Population Increase (Births ‐Deaths): 2012 to 2060
Chart
Source: Census

IQ Valumentum Screen

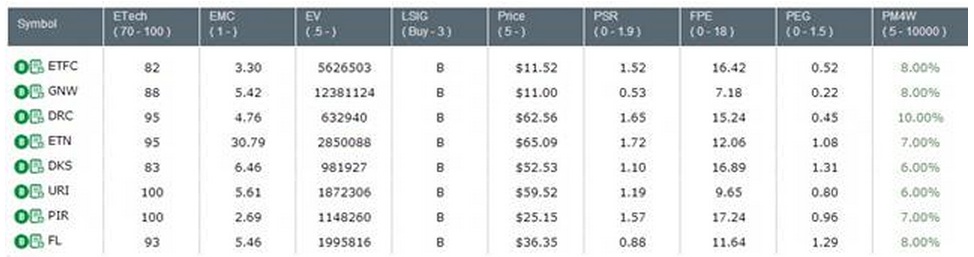
Posted: 20 May 2013 11:30 AM PDT

Here is a good valumentum (value + momentum) screen we came up with using FusionIQ
http://www.fusionmarketsite.com/?p=9501

It's time for another installment of FusionIQ's Screen Pass.  IQ Screen Pass utilizes FusionIO's proprietary metrics along with widely followed industry metrics to create high level investing and trading screens.  Today's edition of Screen Pass looks for stocks that combine both Value and Momentum, or as we like to call it … Valumentum.

The variables used in today's screen are as follows: (1) Fusion Technical Scores (ETech) between 70 – 100; (2) Market Cap (EMC) of > $ 1 billion; (3) Trading Volume (EV) of 500,000 or >; (4) Closing Price (Price) of > $ 5; (5) Price to Sales Ratio (PSR) of < 1.9; (6) Forward P/E < 18; (7) Price to Growth Ratio (PEG) of < 1.5; and (8) out-performance vs. the S&P 500 (market) over the last 4 weeks of > 5 % (PM4W).

With the market rising a lot of late, we wanted to add a value component to our momentum inputs, to gives us the best of both worlds.

Eight stocks hit today's list; E-Trade Financial (ETFC), Genworth Financial (GNW), Dresser-Rand Group (DRC), Eaton Corp (ETN), Dicks Sporting Goods (DKS), United Rentals (URI),Pier 1 Imports (PIR) and Foot Locker (FL).

Click to enlarge
Table

US Quantitative Primer 2013

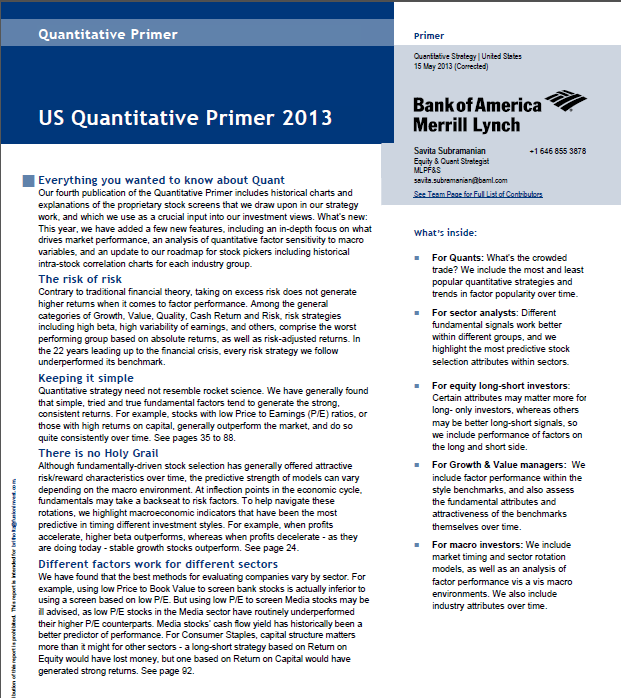
Posted: 20 May 2013 09:00 AM PDT

Last week, I mentioned Merrill Lynch’s Market Analysis Technical Handbook. I was somewhat smitten by the wire house attempt to explain the basics of technicals to a broader layperson audience.

Several BP readers at Mother Merrill (as she used to be known) directed my attention to another annual release: US Quantitative Primer 2013. It is described thusly:

Everything you wanted to know about Quant
Our fourth publication of the Quantitative Primer includes historical charts and
explanations of the proprietary stock screens that we draw upon in our strategy
work, and which we use as a crucial input into our investment views. What's new:

This year, we have added a few new features, including an in-depth focus on what drives market performance, an analysis of quantitative factor sensitivity to macro variables, and an update to our roadmap for stock pickers including historical intra-stock correlation charts for each industry group.

Again, color me impressed that a big firm would put out a document that at its heart challenges many of the fundamental principles the rest of the firm is built upon.

I do not see a public link for this one (either) but I have put in a request.


US QUant


Source:
Everything you wanted to know about Quant
Savita Subramanian
Equity & Quant Strategist
MLPF&S

10 Monday AM Reads

Posted: 20 May 2013 07:00 AM PDT

My morning reads:

• Dynamic Duo: Why Leon Cooperman and Steve Einhorn think this bull market still has legs (Barron’s) but see How Likely is A Continued Market Rise? (Avondale Asset Management)
• Why Precious Metals are Taking a Pasting (Moneybeat)
• Notes From the London Value Investor Conference 2013: Marks, Price, Montier & More (Market Folly)
• Recession Watch: ECRI’s Weekly Leading Indicator Declines Advisor Perspectives (Advisor Perspectives)
• U.S. Bonds Cheapest Since '90 Versus Bunds Counter Buffett (Bloomberg) see also Money isn't "easy"– A rant (The Money Illusion)
• A Small Part of the Brain, and Its Profound Effects (NYT)
• Everything Apple Needs to Introduce at WWDC to Appease the Internet (carpeaqua)
• The Tragic Beauty of Google+ (Time)
• Quinn Sullivan, 14-Year-Old Blues Prodigy, Impresses the Masters (Rolling Stone)
• What I Learned From Watching Every Single Episode of The Office (Esquire)

What are you reading?


Is This the Best Time for Investors? Don’t Bet On It.
Chart
Source: WSJ

What Is Your Market Context?

Posted: 20 May 2013 04:00 AM PDT

What year is it?

That seems to be one of the themes that keeps popping up lately. What year is 2013 like? Is it 1999 and we are about to crash? Is it 1982 and we are on the verge of a multi-decade bull run? Or are we heading for a 1987-like debacle?

The answer is none of the above. The circumstances today do not have any exact parallel to prior years or cycles. A quote often attributed to Mark Twain* is that “History does not repeat itself, but it does rhyme.” My favorite rhyme this cycle has been 1973-74. I have referenced that repeatedly during and after the 2008-09 crash. To me, the 56% fall and ~74% snapback rally was hard to argue against as the closest historical analogy.

That is, until ZIRP and QE1-4 began. An FOMC engineered 145% rally off of the lows at a 0% Federal Funds rate is simply a case of first impression. There are no historical analogies to the current circumstances. The Fed action has shifted the context debate into a new dimension.

Now before you go accusing me of saying that phrase, a brief word: Many people seem to misunderstand the context of Sir John Templeton’s famous quote: “The four most expensive words in the English language are “this time it’s different.” I have always interpreted that to refer to the fact that since human nature is unchanging, it is never different this time. But this truism does not mean we should not discern different circumstances that drive investors at different parts of the markets cycle. Facts can and do differ. That has major repercussions — at least over the short-to medium term.

How might the Fed engineering of the post-credit crisis recovery manifest itself? I can imagine three possibilities:

1) Stopping the natural recessions and corrections;

2) Skipping the last 5 years of the secular bear market (Its 1982!)

3) Driving us straight to 1987

Let’s briefly consider each of these.

What does it mean that the Fed has stopped the natural recessions and correction cycles? Here we are are, almost five years post the last recession start — and the economy continues its modest recovery. This is what Reinhart & Rogoff paper — the good one — forecast. FOMC policy is stimulating demand for anything credit-driven. This includes corporate CapEx spending, consumer auto purchases and of course Housing. I do not know of any parallels to these circumstances.

Option 2 is skipping the last 5 years of the secular bear market and fast forwarding us to 1982. Problem is, P/E ratios never quite got low enough and dividend yields never got high enough. However, the credible counter argument is simply low rates removed the expected competition. Without risk-free US Treasuries yielding 14%, the major competitor to equities never materialized. Hence, stocks were prevented from finding their natural floor.

The final option is that the Fed is driving us straight to the 1987 crash. Professional money managers have been forced in; dividend stocks are the new treasuries. Even mom & pop are starting to look at the stock market. The flip side of this is that after nearly 40 months of outflows from equity funds, we now have but 5 consecutive months of modest (at best) inflows. Bond funds are still attracting more dollars.

~~~

There are lots of other factors affecting markets: Taxes are low, Asia’s development, contained labor costs, international market expansion, productivity gains, practically free credit. Hence, why I say there are no direct paralleles to the current circumstances in the market’s history books.

You Humans are the same as you have ever been. Your cognitive biases and emotional (over)reactions are no different than they have ever been. But the circumstances in which you make risk/reward decisions, the context of your investing analyses, are vastly different than what we have become accustomed to.

I suspect this change of context may surprise all of us . . .


___________

*  There is no actual written Twain quote to that effect; The closest version is “It is not worth while to try to keep history from repeating itself, for man’s character will always make the preventing of the repetitions impossible.” (Mark Twain in Eruption: Hitherto Unpublished Pages About Men and Events, edited by Bernard DeVoto, 1940).

Is EVERY Market Rigged?

Posted: 20 May 2013 03:00 AM PDT

European Union Launches Investigation Into Manipulation of Oil Prices Since 2002

CNN reports:

The European Commission raided the offices of Shell, BP and Norway's Statoil this week as part of an investigation into suspected attempts to manipulate global oil prices spanning more than a decade.

None of the companies have been accused of wrongdoing, but the controversy has brought back memories of the Libor rate-rigging scandal that rocked the financial world last year.

***

A review ordered by the British government last year in the wake of the Libor revelations cited "clear" parallels between the work of the oil-price-reporting agencies and Libor.

"[T]hey are both widely used benchmarks that are compiled by private organizations and that are subject to minimal regulation and oversight by regulatory authorities," the review, led by former financial regulator Martin Wheatley, said in August . "To that extent they are also likely to be vulnerable to similar issues with regards to the motivation and opportunity for manipulation and distortion."

***

In a report issued in October, the International Organization of Securities Commissions — an association of regulators — said the ability "to selectively report data on a voluntary basis creates an opportunity for manipulating the commodity market data" submitted to Platts and its competitors.
Responding to questions from IOSCO last year, French oil giant Total said the price-reporting agencies, or PRAs, sometimes "do not assure an accurate representation of the market and consequently deform the real price levels paid at every level of the price chain, including by the consumer." But Total called Platts and its competitors "generally… conscientious and professional."

***

"Even small distortions of assessed prices may have a huge impact on the prices of crude oil, refined oil products and biofuels purchases and sales, potentially harming final consumers," the European Commission said this week.

USA Today notes:

The Commission … said, however, that its probe covers a wide range of oil products — crude oil, biofuels, and refined oil products, which include gasoline, heating oil, petrochemicals and others.

***

The EU said it has concerns that some companies may have tried to manipulate the pricing process by colluding to report distorted prices and by preventing other companies from submitting their own prices.

***

Unlike oil futures, which set prices for contracts, the data used in the MOC process is based on the physical sale and purchase of actual shipments of oil and oil products.

***

According to Statoil, the EU investigation stretches back to 2002, which is when Platts launched its MOC price system in Europe. The suspicion is that some companies may have provided inaccurate information to Platts to affect the oil products' pricing, presumably for financial gain.

Fox points out:

At issue is whether there was collusion to distort prices of crude, refined oil products and ethanol traded during Platts' market-on-close (MOC) system – a daily half-hour "window" in which it sets prices.

But the European Commission also is examining whether companies were prevented from taking part in the price assessment process.

The Guardian writes:

The commission said the alleged price collusion, which may have been going on since 2002, could have had a "huge impact" on the price of petrol at the pumps "potentially harming final consumers".

Lord Oakeshott, former Liberal Democrat Treasury spokesman, said the alleged rigging of oil prices was "as serious as rigging Libor" – which led to banks being fined hundreds of millions of pounds.

He demanded to know why the UK authorities had not taken action earlier and said he would ask questions of the British regulator in Parliament. "Why have we had to wait for Brussels to find out if British oil giants are ripping off British consumers?" he said. "The price of energy ripples right through our economy and really matters to every business and families."

***

Shadow energy and climate change secretary Caroline Flint said: "These are very concerning reports, which if true, suggest shocking behaviour in the oil market that should be dealt with strongly.

"When the allegations of price fixing in the gas market were made, Labour warned that opaque over-the-counter deals and relying on price reporting agencies left the market vulnerable to abuse.

"These latest allegations of price fixing in the oil market raise very similar questions. Consumers need to know that the prices they pay for their energy or petrol are fair, transparent and not being manipulated by traders."

Shadow financial secretary to the Treasury Chris Leslie said: "If oil price fixing has taken place it would be a shocking scandal for our financial markets.

The Telegraph reports:

"97 per cent of all we eat, drink, wear or build has spent some time in a diesel lorry," said a spokesman for FairFuel UK, the lobbyists. "If it is proved, they have been gambling with the very oxygen of our economy."

***

Platts – to determine the benchmark price – examines just trades in the final 30 minutes of the trading day. A group of half a dozen analysts gather round a trading screen and decide on the final price. As with much that goes on in the City, it is a surprisingly old-fashioned method, reliant on gentlemanly conduct. Critics say it leaves the market open to abuse, and the price can suddenly spike or fall in the final minutes of the day.

The New York Times notes of agencies like Platt and Argus Media:

Their influence is extensive. Total, the French oil giant, estimated last year that 75 to 80 percent of crude oil and refined product transactions were linked to the prices published by such agencies.

The Observer writes that manipulation of the oil markets has long been an open secret:

Robert Campbell, a former price reporter at another PRA, Argus – he is now a staffer at Thomson Reuters, which also competes with Platts and others on providing energy news and data – said this a few days ago in a little-noticed commentary: "The vulnerability of physical crude price assessments to manipulation is an open secret within the oil industry. The surprise is that it took regulators so long to open a formal probe."

Reuters points out that the probe may be expanding to the U.S.:

In Washington, the chairman of the Senate energy committee asked the Justice Department to investigate whether alleged price manipulation has boosted fuel prices for U.S. consumers.

"Efforts to manipulate the European oil indices, if proven, may have already impacted U.S. consumers and businesses, because of the interrelationships among world oil markets and hedging practices," Sen. Ron Wyden (D-Ore.), chairman of the Senate Energy and Natural Resources Committee, wrote in a letter to Attorney General Eric H. Holder Jr.

Wyden also asked Justice to investigate whether oil market manipulation was taking place in the United States.

Not only are petroleum products a multi-trillion dollar market on their own, but manipulation of petroleum prices would effect virtually every market in the world.

For example, the Cato Institute notes how many industries use oil:

U.S. industries use petroleum to produce the synthetic fiber used in textile mills making carpeting and fabric from polyester and nylon. U.S. tire plants use petroleum to make synthetic rubber. Other U.S. industries use petroleum to produce plastic, drugs, detergent, deodorant, fertilizer, pesticides, paint, eyeglasses, heart valves, crayons, bubble gum and Vaseline.

The India Times explains that:

The price variation in crude oil impacts the sentiments and hence the volatility in stock markets all over the world. The rise in crude oil prices is not good for the global economy. Price rise in crude oil virtually impacts industries and businesses across the board. Higher crude oil prices mean higher energy prices, which can cause a ripple effect on virtually all business aspects that are dependent on energy (directly or indirectly).

The Federal Reserve Bank of San Francisco points out:

When gasoline prices increase, a larger share of households' budgets is likely to be spent on it, which leaves less to spend on other goods and services. The same goes for businesses whose goods must be shipped from place to place or that use fuel as a major input (such as the airline industry). Higher oil prices tend to make production more expensive for businesses, just as they make it more expensive for households to do the things they normally do.

***

Oil price increases are generally thought to increase inflation and reduce economic growth.

***

Oil prices indirectly affect costs such as transportation, manufacturing, and heating. The increase in these costs can in turn affect the prices of a variety of goods and services, as producers may pass production costs on to consumers.

***

Oil price increases can also stifle the growth of the economy through their effect on the supply and demand for goods other than oil. Increases in oil prices can depress the supply of other goods because they increase the costs of producing them. In economics terminology, high oil prices can shift up the supply curve for the goods and services for which oil is an input.

High oil prices also can reduce demand for other goods because they reduce wealth, as well as induce uncertainty about the future (Sill 2007). One way to analyze the effects of higher oil prices is to think about the higher prices as a tax on consumers (Fernald and Trehan 2005).

The Post Carbon Institute notes (via OilPrice.com) that high oil prices raise food prices as well:

The connection between food and oil is systemic, and the prices of both food and fuel have risen and fallen more or less in tandem in recent years (figure 1). Modern agriculture uses oil products to fuel farm machinery, to transport other inputs to the farm, and to transport farm output to the ultimate consumer. Oil is often also used as input in agricultural chemicals. Oil price increases therefore put pressure on all these aspects of commercial food systems.

Figure 1: Evolution of food and fuel prices, 2000 to 2009
Sources: US Energy Information Administration and FAO.

Economists Nouriel Roubini and Setser note that all recessions after 1973 were associated with oil shocks.

Interest Rates Are Manipulated

Unless you live under a rock, you know about the Libor scandal.

For those just now emerging from a coma, here's a recap:

Derivatives Are Manipulated

The big banks have long manipulated derivatives … a $1,200 Trillion Dollar market.

Indeed, many trillions of dollars of derivatives are being manipulated in the exact same same way that interest rates are fixed: through gamed self-reporting.

Gold and Silver Are Manipulated

The Guardian and Telegraph report that gold and silver prices are "fixed" in the same way as interest rates and derivatives – in daily conference calls by the powers-that-be.

Everything Can Be Manipulated through High-Frequency Trading

Traders with high-tech computers can manipulate stocks, bonds, options, currency and commodities. And see this.

Manipulating Numerous Markets In Myriad Ways

The big banks and other giants manipulate numerous markets in myriad ways, for example:

  • Engaging in mafia-style big-rigging fraud against local governments. See this, this and this
  • Shaving money off of virtually every pension transaction they handled over the course of decades, stealing collectively billions of dollars from pensions worldwide. Details here, here, here, here, here, here, here, here, here, here, here and here
  • Pledging the same mortgage multiple times to different buyers.  See this, this, this, this and this.  This would be like selling your car, and collecting money from 10 different buyers for the same car
  • Pushing investments which they knew were terrible, and then betting against the same investments to make money for themselves. See this, this, this, this and this
  • Engaging in unlawful "Wash Trades" to manipulate asset prices. See this, this and this
  • Participating in various Ponzi schemes. See this, this and this
  • Bribing and bullying ratings agencies to inflate ratings on their risky investments
.

0 comments:

Post a Comment

previous home Next

{8} chatroll


{9} AdBrite FOOTER

{8} Nice Blogs (Adgetize)