.

{2} GoogleTranslate (H)

English French German Spanish Italian Dutch Russian Portuguese Japanese Korean Arabic Chinese Simplified

Our New Stuff

{3} up AdBrite + eToro

Your Ad Here

Monday, April 6, 2015

The Big Picture

The Big Picture


Central Bank Solvency and Inflation

Posted: 06 Apr 2015 02:00 AM PDT

Central Bank Solvency and Inflation
Marco Del Negro and Christopher A. Sims
APRIL 01, 2015


The monetary base in the United States, defined as currency plus bank reserves, grew from about $800 billion in 2008 to $2 trillion in 2012, and to roughly $4 trillion at the end of 2014 (see chart below). Some commentators have viewed this increase in the monetary base as a sure harbinger of inflation. For example, one economist wrote that this "unprecedented expansion of the money supply could make the ’70s look benign." These predictions of inflation rest on the monetarist argument that nominal income is proportional to the money supply. The fact that the money supply has expanded rapidly while real income has grown very modestly means that sooner or later prices will have to catch up. Most academic economists (from Cochrane to Krugman and Mankiw) disagree. The monetarist argument arguably applies only to non-interest-bearing central bank liabilities, but since October 2008 a large fraction of the monetary base has consisted of reserves that pay interest (the so-called IOER, or interest on excess reserves) and one linchpin of the Fed's "policy normalization principles" consists precisely in raising the IOER along with the federal funds rate. Since reserves pay close to market interest rates, they are close substitutes for other short-term assets such as Treasury bills from a bank's perspective. As long as the central bank can affect the return on these short-term assets by adjusting the IOER, controlling inflation with a large balance sheet seems no different than it was before the Great Recession.
U.S. Monetar BaseIn fact, if we look at expansion of the central bank's balance sheet (known as LSAP—large-scale asset purchases—within the Fed, and as QE—quantitative easing—to the rest of the world) from the perspective of the consolidated budget constraint of the U.S. government, we realize that the expansion shortened the maturity structure of the federal debt (at least for the part concerning the purchase of Treasuries), as explained in the LSE post "More Than Meets the Eye: Some Fiscal Implications of Monetary Policy." When the Fed buys long-term Treasuries by issuing interest-bearing reserves, it effectively retires this long-term debt, at least temporarily, and replaces it with very short-term (overnight) debt reserves. Seen from this vantage point, the hyperinflation fears mentioned above appear misplaced: Why should a change in the maturity structure of the federal debt generate hyperinflation as long as the central bank continues to follow a Taylor-type rule for setting interest rates?In our staff report "When Does a Central Bank's Balance Sheet Require Fiscal Support?" we show that there is a potentially big difference between pre- and post-Great Recession central banking. We argue that a large, long-duration central bank balance sheet can, at least in principle, impair a central bank's ability to control inflation if the fiscal authority (the Treasury) refuses to back under any circumstances the central bank's balance sheet.

Our argument is very different from that dismissed at the beginning of this post. It rests on the observation that QE, almost by definition, resulted in a sizable maturity mismatch between the asset and the liability side of the central bank's balance sheet. Many recent papers (for example,Hall and ReisCarpenter et al.; GreenlawHamiltonHooper, andMishkin; and Christensen, Lopez, and Rudebusch) have noted this mismatch, and have computed the implications of different interest rate renormalization paths for remittances from the central bank to the Treasury. Relative to these papers, we explicitly model the fact that seigniorage—revenues arising from currency creation—depends on the path of inflation and interest rates. We show that this endogeneity opens the door to the possibility of multiple equilibria in the absence of fiscal support.

Imagine that you are a Treasury investor and you know that the only resource the central bank can rely upon is seigniorage. You also know that the value of the central bank's assets (long-term bonds) would fall below that of the bank's interest-bearing liabilities (reserves, which are short-term) if high inflation and interest rates were to occur in the near future. Then you put two and two together and figure out that expectations of high inflation would actually force the central bank to rely on seigniorage, thereby validating such expectations. If you can convince your fellow investors that these expectations are to materialize, then your projection can become a self-fulfilling prophecy, reminiscent of second-generation currency crisis models.

Before we go any further, we should stress that this sort of self-fulfilling prophecy is unlikely to take hold in the United States for two reasons. First, we compute in our simulations that the expected present value of seigniorage for the central bank is very high, roughly the size of current U.S. GDP, under a most likely path for future interest rates. As a consequence, it would take very extreme expectations for interest rates to force the central bank to generate more seigniorage and validate the expectations. Moreover, there are reasons to believe that the assumption of no fiscal support under any circumstances is incorrect: if faced with the prospect of high inflation, the Treasury would eventually be willing to provide support to the central bank. Note that this support comes at no cost at all for the Treasury: simply being willing to provide it is enough to nip any hyperinflation in the bud.

What are the policy implications of all this? Certainly not that the central bank should not have engaged in QE. Much research has shown that QE successfully eased financial conditions, thereby promoting economic recovery. Rather, we argue that it would always be appropriate for a central bank to have access to, and be willing to ask for, support for its balance sheet by the fiscal authority. In other words, central bank independence does not mean that the central bank can control inflation regardless of the actions of the fiscal authority. As shown by historyit never has.

Disclaimer
The views expressed in this post are those of the authors and do not necessarily reflect the position of the Federal Reserve Bank of New York or the Federal Reserve System. Any errors or omissions are the responsibility of the authors.


Del_negro_marcoMarco Del Negro is an assistant vice president in the Federal Reserve Bank of New York's Research and Statistics Group.

Christopher A. Sims is John F. Sherrerd '52 University Professor of Economics at Princeton University.

The Shapes of Stories by Kurt Vonnegut

Posted: 05 Apr 2015 05:00 PM PDT


Source: Maya Eilam

The Rise of the ‘Unicorns’

Posted: 05 Apr 2015 01:00 PM PDT


Source: DealBook

April Fools: Apple to Buy Spotify

Posted: 05 Apr 2015 08:00 AM PDT

The price?

A COOL TEN BILLION!

It had to happen. Apple’s stock rises when it has a monopoly. And despite all the iPhone profits, Android has greater worldwide market share. This is not the iPod revolution, wherein a seamless hardware/software combination, of iPod iTunes and FairPlay DRM, ensured that no other player could gain traction. Hell, Apple is losing traction every day in music. And if you believe that Jimmy Iovine can pull a rabbit out of his hat, you believe Jay Z is gonna turn Tidal into a raging success.

That’s right, Jimmy was left out of the negotiations. Tim Cook is still pissed about the U2 fiasco, wherein Iovine paid back the has-been stars and Apple ended up with egg on its face. Apple is a bigger brand than U2, and Cook feels like the company got hijacked, so therefore, just like David Geffen was left out of the MCA/Matsushita negotiations, Jimmy had no part in this purchase, it’s news to him.

Actually, credit Scott Forstall. You remember him, right? Mr. Software, Steve Jobs’s right-hand man? Forstall was agitating for a music streaming service so loudly that he got fired. But after promoting Jony Ive and closing ranks Cook had a chance meeting with Daniel Ek at the San Jose airport, while their respective jets were being gassed, and Cook realized the error of his ways. He couldn’t bring back Forstall, but he was man enough to recognize he’d been wrong, as Steve was too, files are history, streams are forever.

So the seed was planted YEARS ago! That’s why Spotify has never gone public. Projects at Apple take as long to develop as movies at Pixar and while you were looking for an Apple TV set and deriding Jony Ive’s Watch, Cook was positioning the company to win, and win big.

That’s right, now Apple’s going to own streaming music, no one else will be able to compete, it’s monopoly time all over again.

So what’s the first lesson here?

Live like a king. Get a NetJet account. You can’t advance your career flying coach. Just like a wannabe leases a BMW in Los Angeles, in Silicon Valley you fly private. For the hang. For the business.

~~~

Anyway, Apple is behind the eight ball in music. iTunes sales are faltering and iTunes Radio is a disaster. Sure, iTunes Radio may ultimately triumph in countries Pandora has not entered, but it doesn’t look good.

And Spotify looks great.

Don’t believe the naysayers. Spotify’s footprint is immense, it’s in almost every country with an economy. And as Daniel Ek so famously says, if they stopped expanding/investing, they’d be profitable today. Sure, the business was built on musicians’ backs, but we reward superstar coders more than superstar musicians, and conception is everything. In a world of me-too music, Spotify was never a me-too music service.

Spotify had first-mover advantage.

Which is why Beats Music could never catch it. Why Rdio and Deezer can’t catch it.

Along with the deep pockets to give the music away for free.

And no one has a deeper pocket than Apple. They’re the only one who could overpay for Spotify, because not only do they have the cash, they’re the only one who can benefit from the synergy of the acquisition!

That Beats Music service that Ian Rogers has been working on so hard?

It’s the equivalent of Copland, the unworkable OS that caused Gil Amelio to purchase NeXT and gain what evolved into OS X.

That’s why Beats/Apple Music has never relaunched. It’s too buggy!

So, Spotify will now be Apple’s default service. With a reskinning and a rebranding. They’ve been working on this for two years, but the software is now launch-ready. It’s akin to the Mac’s switch from PowerPC to Intel. By time they announced it, they were ready to do it, all the work had already been done!

But the free tier doesn’t go away.

This is Jimmy Iovine’s middle finger to the music industry.

That’s right, Jimmy is incredibly pissed the label bosses wouldn’t agree to lower the price of an Apple streaming service to $7.99 a month. And he’s now getting the last laugh. Because with Apple the only game in town, Lucian Grainge has to bow to his will. It’ll be ten bucks a month for all you can eat, or you can experience the ads and listen for free. Apple has money to lose as it tightens its grip on streaming music.

That’s right, it’s over. No other enterprise has pockets this deep, software this good and mindshare/rep of an equivalent stature.

Launch date is Friday May 15th.

Why?

BECAUSE IT’S THE START OF TAYLOR SWIFT’S 1989 TOUR!

It was all a head fake. The joke is on you. Taylor’s been in cahoots with Apple for nearly a year. She removed her music from Spotify in order to drive down the purchase price! Every dollar below $10 bil was hers to keep. Alas, she was unsuccessful in this effort, but she’s coming out fine. She’s gonna get a dollar for every sign-up for the first twelve months. So, expect her to hawk Apple’s streaming service like she hawked her album, and no one’s a better marketer than Taylor, no one’s got a better relationship with the press. Didn’t you notice her absence at the Tidal press conference? She, of all people, should have been there. But “1989″ isn’t even streamable on Tidal, doesn’t that tell you something?

And now you know why Mercedes-Benz was a late addition sponsor to the Rock In Rio festival in Las Vegas. That’s where Taylor’s headlining on the 15th. Mercedes-Benz is going to give everyone who purchases an automobile a lifetime subscription to Apple’s streaming service, as long as they continue to drive an MBZ. It’s a win-win.

So where does this leave Tidal?

Dead in the water, where it already is. A bunch of the artists involved were already eager to bolt from Live Nation’s management division after Monday’s debacle, now this sale will anger them even further. It was all masterminded by Guy Oseary, the same guy who was responsible for the U2 album fiasco. Rumor has it they’re all going to march en masse into Irving Azoff’s fold, now that his non-compete has expired, but that has not yet been substantiated. But the reason MSG is dividing in two is to free up money for further acquisitions by Irving, so all signs are pointing in this direction.

The other streaming services will fade away and will not radiate. Because online only one entity wins, you gravitate to where all your friends are.

All the exclusives will be on Apple. The streaming service will work on Android and Windows, but icons will not look as sharp and functionality will be hampered in order to force people to buy Apple hardware. It’s all about the hardware, you know that, right? It’s the reverse razor blade theory. You give away the software to sell expensive hardware!

So now Apple owns music.

They’re not going to buy labels. That’s ridiculous. Who needs the headache?

But they are going to release data, so that acts will know that it’s the labels screwing artists, not the streaming service.

So the war is over. You can stop bitching about Spotify. You can get back to making good music, if you ever did.

As for consumers, this is heaven. And books and television are next.

Apple plans to corner the market on TV distribution, their deal with HBO is just the beginning. And despite being judged guilty of price-fixing re books, the publishers are still angry at Amazon and are willing to throw in with Cook for a subscription service. They get to set the price. Apple will just take its traditional 30%. Amazon’s reading devices suck anyway, and this is just a further way to cement Apple’s power in tablets, a way to goose sales, which have suddenly stalled.

So, it’s been proven that Tim Cook is quite the match for Steve Jobs. Just like he green-lit the evisceration of skeuomorphism, he’s pivoting the company to streaming content. He knows that streaming is the future.

DO YOU?

~~~


Visit the archive:   http://lefsetz.com/wordpress/

@Twitter  http://www.twitter.com/lefsetz

If you would like to subscribe to the LefsetzLetter

10 Sunday Reads

Posted: 05 Apr 2015 04:30 AM PDT

Good morning — round out your weekend with our Sunday morning reads:

• Mohamed A. El-Erian: Eight Takeaways From the March Jobs Report (Bloomberg View)
• Victims of Financial Wrongdoing Need a More Muscular S.E.C. (NYT)
• Are Index-Fund Investors Smarter? (Total Return) see also Would Benjamin Graham Have Hated Index Funds? (Total Return)
• Marc Andreessen: The secret weapon of HBO’s Silicon Valley (Yahoo)
• The Ultimate Amazon Product (The Awl)
• When 'Moneyball' Meets Medicine (Upshot)
• This time is not different, USD edition (FT Alphaville)
• Who’s Who in music streaming: Spotify, Pandora, Tidal, Google, Apple, Amazon, Samsung (IBN Live)
• Mike Pence's New Fan Club: Wiccans (Daily Beast) see also Next, We Muslims Bring Sharia to Indiana (Daily Beast)
• The Teenager & The Porn Star: Will 18-year-old Sasha Grey become the adult film industry's next Jenna Jameson? (Los Angeles Magazine)

What are you reading?


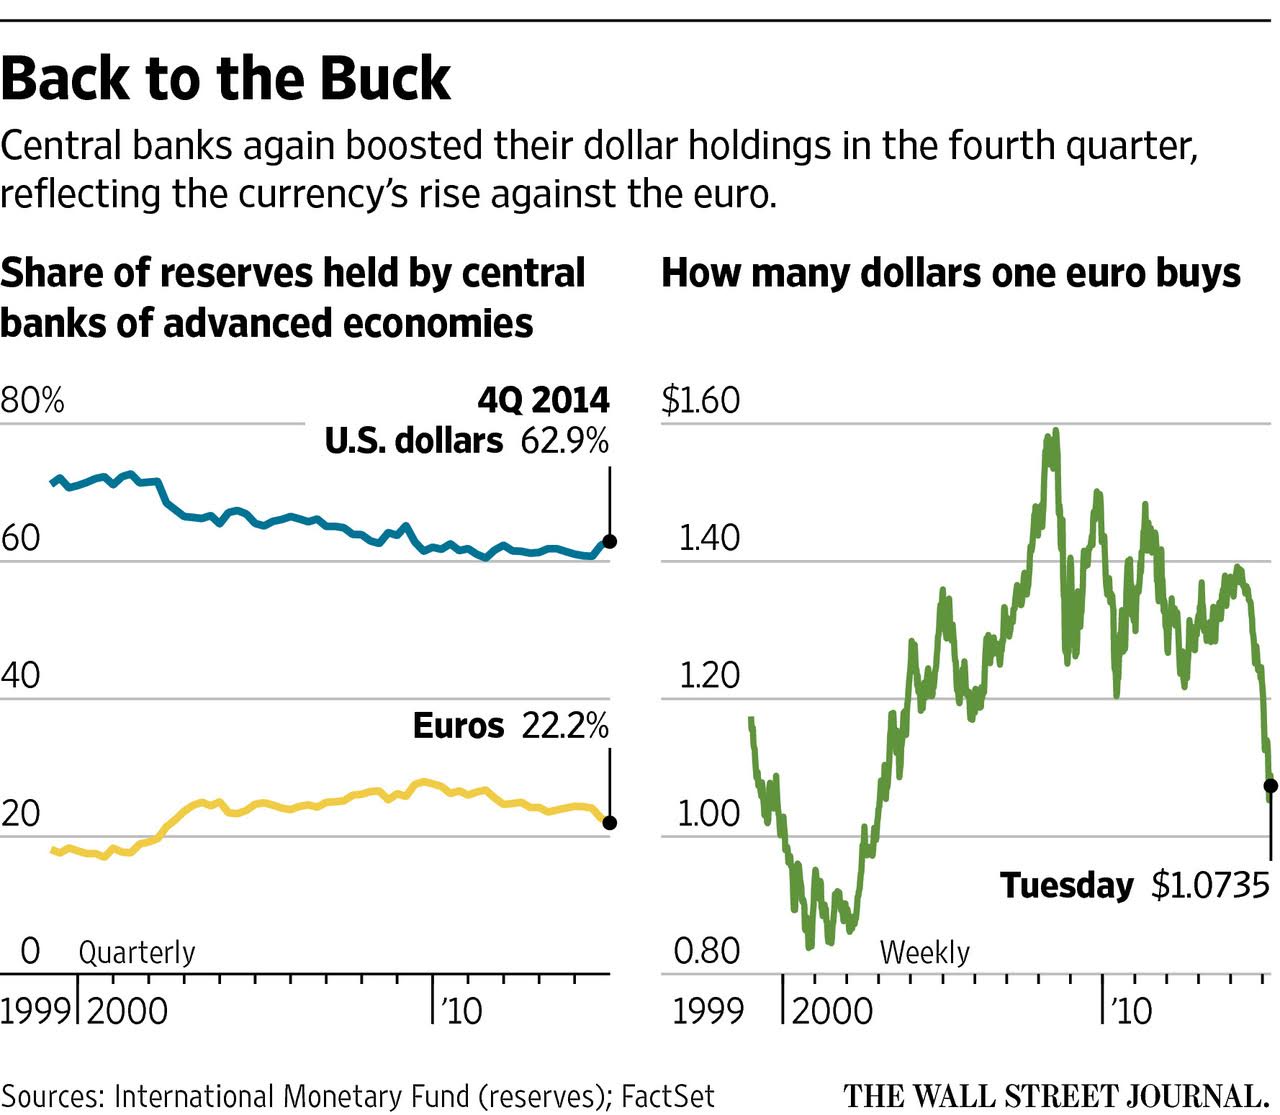
Central Banks Again Boosted Their Dollar Holdings

Source: WSJ


.

Sunday, April 5, 2015

The Big Picture

The Big Picture


Mission: Impossible Rogue Nation

Posted: 04 Apr 2015 05:00 PM PDT

The Mission: Impossible Rogue Nation trailer starring Tom Cruise.

Best Way to Find Airfare Online

Posted: 04 Apr 2015 01:00 PM PDT


Source: WSJ

MiB: Bobby Flay

Posted: 04 Apr 2015 07:00 AM PDT

This week, our Masters in Business radio podcast features Bobby Flay, Chef, Restaurateur, cookbook author, and star of of the Food Network.

Flay dropped out of high school, and started working in restaurants. His potential was recognized by Joe Allen, who sent him to the French Culinary Institute. He became the head chef of Miracle Grill, bringing Southwestern cuisine to New York City for the first time. He opened his first restaurant, Mesa, which became a sensation, winning accolades and awards, including restaurant of the year.

Flay is also the star or host of more than a dozen shows on the Food Networks, and the author of 12 cookbooks, including Bobby Flay’s Bold American FoodBobby Flay’s Barbecue Addiction, and Mesa.

Listen to the show live on Bloomberg radio 10-11am today, 6-7pm, and check out the podcast at Bloomberg, on Apple iTunes or SoundCloud. All of our prior podcasts are now available on iTunes.

Next week, we speak with Rick Ferri of Portfolio Solutions.

10 Weekend Reads

Posted: 04 Apr 2015 03:00 AM PDT

Good Saturday morning. Pour yourself a hot mug of Brazilian Arabica, and enjoy our longer form weekend reads:

• iPhone Killer: The Secret History of the Apple Watch (Wired)
• Renegades of Junk: The Rise and Fall of the Drexel Empire (Bloomberg)
• Wall Street Executives from the Financial Crisis of 2008: Where Are They Now? (Vanity Fair)
• The PayPal Mafia: An inside look at the hyperintelligent, superconnected pack of serial entrepreneurs who left the payment service and are turning Silicon Valley upside down. (Fortune)
• The Great Cocaine Treasure Hunt: If you knew where a million dollars’ worth of blow was buried, would you go dig it up? Rodney Hyden would. We pick up the story at this critical juncture (GQ)
• The Revolution Will Probably Wear Mom Jeans (The Baffler)
• Inside the Weird, Noble World of Autograph Collectors (Vice)
• Tech companies are sending your secrets to crowdsourced armies of low-paid workers (Fusion)
• Counter-Swarm: A Guide to Defeating Robotic Swarms (War On The Rocks)
• Six seconds that shaped 1,500 songs (BBC) see also 70 songs to celebrate Eric Clapton’s 70th birthday (Mashable)

Be sure to check out this week’s Masters in Business with chef and restaurateur Bobby Flay.


Record Temperatures Impacted Consumers

Source: MarketWatch


.

Saturday, April 4, 2015

The Big Picture

The Big Picture


Uptown Passover

Posted: 03 Apr 2015 04:00 PM PDT

This Passover, we’re taking our seder “uptown”. Hope your Pesach is as funky fresh as can be!

This song and all Six13 songs are completely a cappella — created with nothing but the human voice.

Speaking of which, we released our brand new album TODAY! It’s called Six13, Vol. 6: Thirteen. It We’re extremely proud of it and hope you’ll buy one at Aderet Music or download it on iTunes!

Succinct Summation of Week’s Events 3.3.15

Posted: 03 Apr 2015 11:00 AM PDT

Succinct Summations week ending April 3rd

Positives:

1. Initial jobless claims fell to 268k, the lowest level in 15 years.
2. Euro-area economic sentiment rose to 103.9, the highest level in nearly four years.
3. Pending homes sales increased 3.1%, the highest reading since June 2013 and above the 0.3% expected rise.
4. Personal income rose 0.4%, better than the 0.3% expected rise.
5. S&P/Case-Shiller home price index rose 0.87% and 4.56% y/o/y, in line with expectations.
6. Markit manufacturing came in at 55.7, slightly better than the 55.3 expected.
7. The S&P 500 finished the quarter in the green for the ninth consecutive time.
8. Unemployment came in at 5.5% and wages rose 0.3% m/o/m and 2.1% y/o/y.

Negatives:

1. NFP came in at 126k vs expectations of 245k, the lowest number since December '13
2. US Private Payrolls added 189k jobs in March vs the 225k expected.
3. The Dallas Fed Manufacturing Index fell from -11.2 to -17.4 in March.
4. Consumer spending rose 0.1%, up from the -0.2% fall in February, but below the 0.2% expected change.
5. ISM manufacturing fell to 51.5, below the 52.5 expected and the slowest expansions since May 2013.
6. Construction spending fell 0.1% m/o/m, in line with expectations.
7. January and February payroll were revised lower by almost 70k.


Thanks, Mike!


Net Migration Between California and Other States: 1955-1960 and 1995-2000

Posted: 03 Apr 2015 09:00 AM PDT


Source: US Census

Nobel Prize for Economics

Posted: 03 Apr 2015 06:00 AM PDT


Source: Dilbert

10 Good Friday Reads

Posted: 03 Apr 2015 04:00 AM PDT

Its Good Friday, and the start of Passover. Here are your 3 day weekend at home morning reads:

• Opening Windows: A once-dominant software giant is determined to prove that life begins again at 40 (The Economist)
• G.M. Bets Big on a Resurgent Cadillac (NY Times)
• Why Data Breaches Don't Hurt Stock Prices (HBR)
• The Monetarist Mistake (Project Syndicate) see also Milton Friedman, Monetarism, and the Great and Little Depressions (Uneasy Money)
• Tidal and the Future of Music (stratechery)
• Wal-Mart, GE Pressure Has States Changing Tune on Gay Rights (Bloomberg)   see also Indiana’s Religious Conservatives Surrender (Bloomberg View)
• The Best Way to Find an Airfare Online (WSJ)
• Why Obama chose the Iran talks to take one of his presidency's biggest risks (Washington Post) see also  Iran nuclear talks: a very simple guide (Vox)
How the Gluteus Became Maximus: Debate among scholars about the true origin of a preference among males for curvier backsides. (The Atlantic)
• Adam Riches on Bill Murray: 'Ghostbusters made me want to be funny' (The Guardian)

What are you reading?


The deficit as a proportion of GDP

Source: Office for Budget Responsibility


2016 McLaren 570S Coupe

Posted: 03 Apr 2015 03:00 AM PDT

The next McClaren is an “affordable supercar — as others have written, its much more than just another run of the mill 911-fighter.

I really like the styling (but abhor the lack of manual stick shift). The two-tone color scheme really works, building upon what the Audi R8 “Blade” revived.

That orange is reminiscent of Lamborghini (or my Jeep Rubicon), and the stealthy gray is a but subdued for my taste. IMO, the pearlescent blue (seen in X-Box Forza) or even the P1 Yellow (of P1 GTR fame) are better choices than  orange or the gray.

McLaren is getting serious about being more than a niche automaker: They plan a new model launches may every year until 2022.


From McLaren:

“The new 570S Coupé is a classic sports car with a mid-mounted engine, rear-wheel drive layout and a carbon fibre chassis. The M838TE twin-turbo V8 engine produces 570PS (562bhp) and 600Nm (442lb ft), with 30 percent of components bespoke to the Sports Series. Power is delivered through a seven-speed SSG transmission and transmitted to the road via Pirelli P-Zero™ Corsa tyres, and this power is brought under control with standard-fit carbon ceramic brakes. The Sports Series has its own newly developed suspension system along with 'Normal', 'Sport' and 'Track' handling settings.”

PERFORMANCE:
0-100 km/h (0-62 mph): 3.2 seconds
0-200 km/h (0-124 mph): 9.5 seconds
Top speed: 328 km/h (204 mph)


4

9

7


3

Source: McLaren


3


Videos (and more photos) after the jump


You car notes:

The Coupé is the first bodystyle to be shown in the Sports Series, highlighting the latest evolution of the McLaren design philosophy. The 'shrinkwrapped', aerodynamically-optimised form will be seen in public for the first time at the 115th New York International Auto Show. The McLaren design team has created a shape of beauty highlighted by details such as the rear flying buttresses that increase downforce as well as adding grace, and complex door tendons that direct additional air to cool the mid-mounted V8 engine.

The Sports Series features an evolution of the 3.8-litre V8 twin turbo engine, named M838TE, with 30 percent of components bespoke to the new model. Engineered by McLaren, it produces 570PS (562 bhp) at 7,400 rpm, and 600Nm (443 lb ft) of torque at 5,000-6,500 rpm. Power is delivered through a seven-speed SSG transmission, and transferred to the road through the rear wheels. This power is brought under control with standard-fit carbon ceramic brakes, fitted behind a newly designed range of forged alloy wheel options with P Zero Corsa tyres as standard from McLaren technical partner, Pirelli – 225/35/R19 on the front and 285/35/R20 on the rear.

The unique carbon fibre MonoCell II chassis has been newly designed with more of a focus on day-to-day usability, offering improved ingress and egress from the cabin. It is incredibly strong and stiff yet weighs less than 80kg, offering optimum levels of protection. This lightweight structure, and the use of aluminium body panels, contributes to a dry weight of as low as 1,313kg (2,895lbs), almost 150kg lighter than its closest competitor.
Minimised weight and a turbocharged engine doesn't just bring great performance. The 570S also delivers excellent fuel efficiency and emissions for car that is also a member of the 200mph club, with fuel economy of 25.5mpg on the EU combined cycle, and emissions of 258g/km. For the US market, this means exemption from gas guzzler tax.


5
Source: Bloomberg

1

2


2


5


4

1

2

8


1

3

1


4

6

2


a

3
Sources: Top Gear, Jalopnik

.

Friday, April 3, 2015

The Big Picture

The Big Picture


Combining Models for Forecasting and Policy Analysis

Posted: 03 Apr 2015 02:00 AM PDT

by Marco Del Negro, Raiden Hasegawa, and Frank Schorfheide

Model uncertainty is pervasive. Economists, bloggers, policymakers all have different views of how the world works and what economic policies would make it better. These views are, like it or not, models. Some people spell them out in their entirety, equations and all. Others refuse to use the word altogether, possibly out of fear of being falsified. No model is "right," of course, but some models are worse than others, and we can have an idea of which is which by comparing their predictions with what actually happened. If you are open-minded, you may actually want to combine models in making forecasts or policy analysis. This post discusses one way to do this, based on a recent paper of ours (Del Negro, Hasegawa, and Schorfheide 2014).

We call our approach "dynamic prediction pools," where "pools" is just another word for model combination and "dynamic" sounds a lot better than "static." Seriously, we want an approach to combining models that recognizes the fact that the world changes, that we have no perfect model, and that models that worked well in some periods may not work well in others. We apply our approach to two New Keynesian Dynamic Stochastic General Equilibrium (DSGE) models, one with and one without financial frictions. (We call them SWπ and SWFF, respectively, where the SW underlines the fact that they are both based on the seminal work of (Smets and Wouters.) So much for model diversity, you may be thinking. Aren't these two models like Tweedledee and Tweedledum? Not quite, as the chart below shows.

The chart (which is taken from a different paper of ours, Del Negro and Schorfheide [2013]) shows the two DSGE model forecasts for output growth and inflation obtained with information available on January 10, 2009, at the apex of the financial crisis (2008:Q4 information was not yet available on that date, so this forecast is effectively based on National Income and Product Account data up to 2008:Q3). Specifically, each panel shows GDP growth (upper panels) or inflation (lower panels) data available at the time (the solid black line), the DSGE model's mean forecasts (the red line), and bands of the forecast distribution (the shaded blue areas representing the 50, 60, 70, 80, and 90 percent bands for the forecast distribution in decreasing shade). The chart also shows the Blue Chip forecasts (diamonds) released on January 10, and the actual realizations, according to a May 2011 vintage of data (the dashed black line). All the numbers are quarter-over-quarter percent change.

It appears that an econometrician using the SWπ model would have had no clue of what was happening to the economy. The SWFF model, though, predicts output in 2008:Q4 just as well as the Blue Chip forecasters and a subsequent very sluggish recovery and low inflation, which is more or less what happened afterwards. (To better understand the behavior of inflation in the last five years, see a previous Liberty Street Economics post entitled "Inflation in the Great Recession and New Keynesian Models.") The key difference between the two models is that SWFF uses spreads as a piece of information for forecasting (the spread between the Baa corporate bond yield and the yield on ten-year Treasuries, to be precise) while the SWπ model does not. The reason why we look at these two models is that before the crisis many macroeconomists thought that spreads and other financial variables were not of much help in forecasting (see this article by Stock and Watson).

The chart above suggests that the issue of which of the two models forecasts better is pretty settled. Yet the chart below shows that this conclusion would not be correct. It shows the forecasting accuracy from 1991 to 2011 for the SSWπ (the blue line) and the SWFF (the red line) models, as measured by the log-likelihood of predicting what actually happened in terms of four-quarter averages of output growth and inflation, with lower numbers meaning that the model was less useful in predicting what happened. For long stretches of time, the model without financial frictions actually forecasts better than the model with frictions. This result is in line with Stock and Watson's findings that financial variables are useful at some times, but not all times. Not surprisingly, these stretches of time coincide with "financially tranquil" periods, while during "financially turbulent" periods such as the dot-com bust period and, most notably, the Great Recession, the SWFF model is superior.

The relative forecasting accuracy of the two models changes over time and so we would like a procedure that puts more weight on the model that is best at a given point in time. Does our dynamic pools procedure accomplish that? You can judge for yourself from the chart below, which shows in three dimensions the distribution of the weights over time (the weights are computed using an algorithm called "particle filter"; we make both the codes and the data–the log-likelihoods of the two models shown in the chart above–available). We want to stress that this exercise is done using real-time information only—that is, for projections made in 2008:Q3, no data past that date were used in constructing the weights. The distribution of the weights moves like water in a bucket. When there is little information, such as at the beginning of the sample when the difference in forecasting ability between the models is small, the distribution is flat. During periods when one model is clearly better than the other, the bucket tilts to one side, and the water/mass piles up at the extremes.

Fortunately, the mass seems to move from one side to the other of the bucket in a fairly timely way. The chart below compares the forecasting accuracy of the SWπ and SWFF models with that of dynamic pools (in black). As we noted before, the ideal model combination is the one that puts all the weight on the model that has the most accurate projection. The problem is, you know which one that is only afterwards. A measure of success is the extent to which your real-time combination produces a forecast that is as accurate as possible to that of the best model. The chart shows that the forecast accuracy of the dynamic pools approach is quite close to that of the best model most of the time, and in particular during the Great Recession. This confirms that the bucket tilted early enough in the game and shifted the weight toward the model with financial frictions. We show in the paper that, because of this timeliness, our procedure does generally better than the competition in terms of out-of-sample forecasting performance.

Now, imagine you are a policymaker and are contemplating the implementation of a given policy. Consider also that this policy achieves the desired outcome in one model, but not in the other. Clearly the decision of whether to implement the policy depends on which model is the right one. You do not quite know that, but you do know the weights. Using them to come up with an assessment of the pros and cons of a given policy is the topic of our next post.

Source: Federal Reserve Bank of New York

State Minimum Wage Map

Posted: 02 Apr 2015 01:00 PM PDT


Source: Bloomberg

Millenials, Social Media + Competition for Employees Are Behind McDonald’s Pay Raise

Posted: 02 Apr 2015 08:30 AM PDT

There has been surprising news across minimum-wage land: Paychecks are beginning to rise. Earlier this year, Wal-Mart raised its minimum pay to $9 an hour, then Target matched. Now McDonald’shas improved on those rates. Starting July 1, McDonald's will pay at least $1 an hour more than the local minimum wage for workers at the restaurants it owns in the U.S., the Wall Street Journal reported.

As always, the devil is in the details. And while those details have been far less dramatic than the headlines, they are worth exploring. The motivations of the companies are even more intriguing. Before we delve into why McDonald’s did this, let’s look at a bit of recent history.

In February, Wal-Mart, the nation’s largest private employer, said that as of this month it would raise its minimum pay nationwide to $9 an hour — $1.75 more than the federal minimum of $7.25. As we noted, this was a raise for about a half-million Wal-Mart workers in the U.S. In February 2016, the company's minimum rises to $10.

Continues here: The Empty Feeling of McDonald’s Pay Raise


The Anomaly That Is The Payroll Report

Posted: 02 Apr 2015 06:00 AM PDT

1

Goldman Sachs – David Mericle: Has Employment Growth Been Running Too Hot? (No Link)
We use the model to project employment growth through 2016. To do so, we use our baseline growth and investment forecasts and assume that the recent rate of multi-factor productivity growth remains unchanged. To be clear, we assume that GDP growth returns to a 3% rate starting in 2015Q2 rather than continuing at the softer rate implied by the CAI and our Q1 GDP tracking estimate of 2.0%. We also consider two alternative growth forecasts in which GDP grows 0.5pp faster or slower than in our baseline. Exhibit 3 shows the results, translated into monthly employment gains. The model implies that payroll employment growth has indeed been running "too hot" recently. While the significant weight on the momentum variables in the short-run equation suggests that the deceleration is likely to be gradual, we expect payroll growth to eventually decline to just under 200k/month under our baseline forecast. This forecast is roughly in line with a simpler Okun's law rule-of-thumb, which says that growth roughly 1pp above potential for one year should reduce the unemployment rate by about 0.5pp, requiring an extra 65k jobs a month. Adding that figure to trend employment growth implies total monthly employment gains in the neighborhood of 200k.

Comment

The above Goldman report caught our eye recently. The baseline scenario of their nonfarm payroll model concludes job growth will eventually decline to just under 200k jobs per month. As with any model, however, the output is only as good as the assumptions used when calculating the figures. Consider the following regarding Goldman's GDP assumptions:

    The baseline scenario (3.0% GDP in 2015) is something that has not happened on a yearly basis in the post-crisis era. So Goldman is predicting 2015 will be the best growth year of the recovery.
    The stronger growth scenario (3.5% GDP in 2015) last happened on a yearly basis in 2004. You have to go back to the dotcom mania of the late 90s to find a period when 3.5% GDP in a given year was the norm.
    The weaker growth scenario (2.5% GDP in 2015) is still a higher bar than occurred 2014 (2.4%), 2013 (2.2%), 2012 (2.3%) and 2011 (1.6%). So a five-year high in growth is now the "weak" scenario?

Payrolls have actually been outpacing GDP growth to such a degree that productivity is collapsing. Note the chart below is through Q4. If the Atlanta Fed's GDPNow current level holds, we could see an even bigger plunge in productivity when Q1 data is released. As we wrote last week:

    Has the American economic suddenly become inefficient? We doubt it, so maybe some of the data is wrong. Most are inclined to explain away the poor data by pointing to factors such as weather. Maybe the weak data, which constitutes the majority of economic releases, is not wrong though. Perhaps we should be re-examining the one data point that is strong, non-farm payrolls.
    According to Occam’s Razor, the simplest answer is often the best. Rather than trying to explain away the myriad of poor economic releases, wouldn't it be easier to be suspect of the one outlier that is pointing to robust growth?

2

On top of productivity declining and the low level of the Atlanta Fed's GDPNow, the chart below shows industrial production has also fallen off a cliff.

3

The narrative told by the charts above have led us to question why the jobs numbers have been so robust lately. Why are companies supposedly hiring at such a healthy pace in the face of slowing growth? As the chart below shows, manufacturing hiring is picking up nicely.

4

As the red line in the chart below shows, housing starts also fell considerably from January to February.

5

This has not affected residential construction job growth though. Note the chart below shows residential construction jobs grew by 17,200 in February. This is the second-best month of hiring since 2011. This number is seasonally adjusted. The unadjusted number grew by exactly 10,000. So what did these 10,000 new jobs do if far fewer homes were being built?

6

The next two charts look closely at job growth in the retail sector. As the first chart shows, hiring has continued in this sector despite a slowdown in retail sales.

7

8

Conclusion

Job growth in manufacturing, residential construction and retailing accounted for almost a third of February's blow-out nonfarm payroll number. Are we to believe all these industries were hiring at such a healthy pace despite the decline in growth? If this is the case, the productivity numbers will continue to collapse and the Fed will have a serious problem on its hands. We, on the other hand, suspect something might be amiss with the payroll numbers. These numbers are telling a far different narrative from most other economic data.

10 Thursday AM Reads

Posted: 02 Apr 2015 04:30 AM PDT

The news flow never stops, and neither does our braised, slow smoked morning train reads:

• Everybody Plays the Fool (Sometimes)  (Above the Marketsee also 5 money habits of the filthy rich you can learn now (Time)
• Would Charles Dow Be Selling Stocks? (Irrelevant Investor)
• Low or High Inflation? Nope, Stealthy Government Debt Liquidation! (Alpha Architectsee also Euro falls on way to worst quarter; dollar best since 2008 (Reuters)
• Bill Gross: March Madness (Janus)
• Has labour lost out to capital? (FTsee also Why China May Have the Most Factory Robots in the World by 2017  (Real Time Economics)
• Frenemies: a story of Iran, Israel, and the United States (Vox)
• Poverty Shrinks Brains from Birth (Scientific American)
• I Followed My Stolen iPhone Across The World, Became A Celebrity In China, And Found A Friend For Life (Buzzfeed)
• Aasif Mandvi: Everything I’ve Done in My Career Has Terrified Me (LinkedIn)
• In defense of Trevor Noah's stupid, tasteless tweets (Washington Post)

What are you reading?

Continues here

The Most Volatile Stocks On Earnings

Source: Bespoke Investment Group


Winners and Loser of the Global Financial Markets

Posted: 02 Apr 2015 03:30 AM PDT


Source: BAML via Bloomberg

.
previous

{8} chatroll


{9} AdBrite FOOTER

{8} Nice Blogs (Adgetize)