


The Big Picture |

- United States Flu Trends
- America: Nation of Deadbeats
- A Tax Barbell
- Dow Jones Industrial Index, Price Return (Since 1900)
- 10 Thursday AM Reads
- Who Owns the U.S. Equity Market?
- Making the TARDIS Bigger On The Inside
- Bad Risk Management – Not Secret Bailouts – Killed These Clients
- James Grant: The Bubble
- How Did Professional Forecasters React to the August 2011 FOMC Statement?
| Posted: 10 Jan 2013 12:30 PM PST |
| Posted: 10 Jan 2013 12:00 PM PST |
| Posted: 10 Jan 2013 10:09 AM PST A Tax Barbell
Washington has handed an economy now struggling to get back on its feet a barbell instead of a helping hand—a tax barbell. With much hoopla and political posturing, the United States' political leadership raised the income taxation on the "rich," as the White House likes to call them. But without a word, the White House and the Congress also raised income taxation on the working poor and lower middle class. That is the effect of the payroll tax (2%) hike. We believe the impact of this tax increase will be a lower economic growth rate for the US than would have been possible if no income tax rate and no payroll tax rate changes had occurred. How much slower is subject to debate, but nothing in the so-called Taxpayer Relief Act affords an iota of relief to anyone who works. Let's focus on the lower end of the income scale, the working population with incomes in five figures. In our view these taxpayers were hit hard. Since most of their incomes are spent on non-discretionary consumption, they will likely invade savings or lower their savings rates in order to sustain themselves. Collectively, they have been hit with a $120 billion annual tax hike. That is nearly $1000 for every working person in America. An analogous situation might be a spike in the price of gasoline. Let's use that to demonstrate the impact of the payroll tax. Suppose the price of gasoline jumped from $3.50 per gallon to $4.50 in one day and stayed at $4.50 for an entire year. How would we react as Americans? We would see the price at the pump as a continuous reminder of the change in our circumstances. We would witness the nightly news reporting this change. We would be livid with politicians, clamoring for them to act. Those are the same politicians who were silent a few days ago. The essence of the question is Americans' behavioral response to a change in economic circumstances. Are we going to see it 2013? The macro numbers would say the answer is yes. Roughly, a penny per gallon change in the gasoline price equates to about $1.2 billion in consumption expenditures per year for American consumers. If we have just imposed a two percent tax on the earned income of most Americans, we have essentially imposed the equivalent of a gasoline price hike of $1 per gallon. What this taxation change means is that the growth rate of the US economic recovery will be slowed measurably. There are models which incorporate the economic growth rate, the population change, and the labor force participation rate. Put them to work, and the result of this barbell taxation is to extend the period needed before the US economy will reduce the unemployment rate to the Fed's target of 6½%. In other words, President Obama's noisy attack on the rich also silently punched out the working poor. But Obama did not do it alone. The Democrats and the Republicans in the House and the Senate were complicit. How many did we hear or see defending the working population whose incomes are $100,000 a year or less? Robust recovery is now less likely in the near future. That is especially true because of the abject failure of the White House and Congress to extend, or make permanent, the 2% reduction in the payroll tax. Cumberland continues to expect a slow, gradually recovering economy. That will continue for a number of years. Interest rates will remain low, although they may be volatile, as we can see in the bond market's response to the Federal Reserve minutes. That structure is bullish for the US stock market. Bond portfolios can use hedging techniques to mitigate some of the volatility in interest rates. Also note the Labor Department estimates of about 460,000 folks counted as employed because the states are paying subsidy to keep the jobs rather than have the person seek unemployment benefits (source: Bloomberg, January 10). The effect is to distort the reported unemployment rate downward because those folks remain "employed". We are not opposing the policy. We are just noting that the Fed's target of a 6 ½% unemployment rate may need to be examined for these changed circumstances which are not in the historical data. This revelation is additional support for our view that the period of low interest rates and ongoing Fed QE policy is longer than markets currently expect. We are scheduled to appear on Bloomberg TV with Trish Regan for the whole hour on Tuesday, January 15 from the 3 to 4 PM (EST). We hope to discuss this reduction of growth due to taxation and what it means for the extended period of low interest rates. ~~~ David R. Kotok, Chairman and Chief Investment Officer Twitter: @CumberlandADV
|
| Dow Jones Industrial Index, Price Return (Since 1900) Posted: 10 Jan 2013 09:00 AM PST click for larger graphic
This morning’s secular bear market discussion sent me scampering for a way to illustrate that. It gave us yet another look at my favorite long term chart. As you can see above, it shows the long term bull and bear markets (for the most part, the dates are reasonable. One quibble: I would also date the post-war bull as beginning 1946 (some have argued for 1942 as well). The good news is we are beginning the 14th year of the Secular Bear market that began in March 2000, making us that much closer to its ultimate end. The bad news is some of these have gone appreciably longer than that (12-18 years in the US). The average of the three prior secular bull markets (18, 12 and 16 years) is a touch over 15 (15.3333). We are quite possibly less than 6 years from the end date, and quite possibly much less. Caveat: Be ware people claiming 1929-49 as a secular Bear — as the chart above makes clear, there was a distinct uptrend from 1932-37.
|
| Posted: 10 Jan 2013 06:55 AM PST My morning reads:
What are you reading?
The appreciating renminbi |
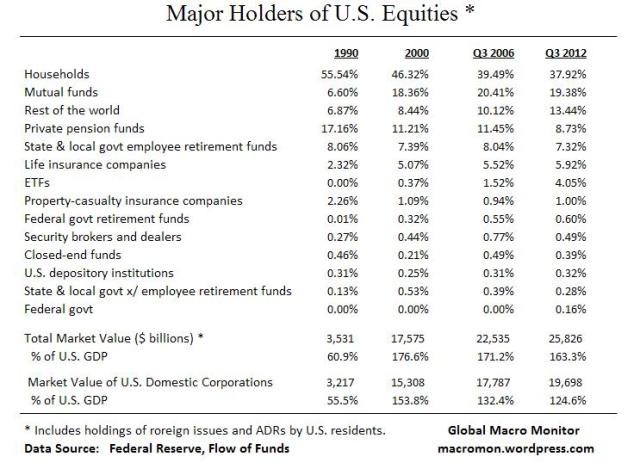
| Who Owns the U.S. Equity Market? Posted: 10 Jan 2013 05:30 AM PST Here's an update and upgrade to our mid-2011 post. Lots of noise and imperfections in the Fed's Flow of Funds data but sure beats the alternative – nothing. The biggest caveat, in our opinion, is the data include holdings of foreign equities by U.S. residents so not a concise measure on how the U.S. stock market is allocated. Also note the household sector includes hedge funds and IRAs. The table below illustrates a large decline in the percentage of the equity market allocated to private pension funds. No doubt there's noise here and it may also be partially explained by demographics but the decline over the past twenty years is glaring. The data also show the growth of mutual funds and ETFs since 1990 as households have reduced holdings of individual stocks and increased allocation into these sectors.
|
| Making the TARDIS Bigger On The Inside Posted: 10 Jan 2013 05:00 AM PST Source: Kumparak |
| Bad Risk Management – Not Secret Bailouts – Killed These Clients Posted: 10 Jan 2013 04:28 AM PST
Most of the time, I am tickled pink at the brutal, no holds barred, Hunter S. Thompsonesque journalism of Matt Taibbi. (Full disclosure, I have been both a quoted and anonymous source for a long time). I tweeted and linked to his latest column, “Secrets and Lies of the Bailout,” which brilliantly depicted the ongoing long con of the bailouts. But I have to lodge a formal disagreement with his latest Taibbiblog post about George Hartzman, a Wachovia/Wells Fargo broker who was “quietly killing it” in 2007-08, shorting financials as well as the market. He drank the Kool-Aid, and was short along with his clients. But like so many traders whose opositions are working, he got arrogant, overstayed his welcome, missed the bottom and reversal. In other words, he and his clients got crushed. It is a cautionary tale that raises many questions. The first I have to ask is this: What business did these mostly conservative clients (and their retirement accounts) have being short? That is a giant regulatory red flag, and a compliance problem. The second issue is the Broker/Dealer model — this guy was a salesman (literally, a kick about, lots of sales jobs including aluminum swimming pools, vinyl siding and even encyclopedias before finding finance). He does not appear to be a true “portfolio manager,” and certainly not a hedge fund manager. To my eye, he — apparently — lacked the skill set and discipline to be managing a large book of shorts positions. Indeed, he was less than an ideal candidate to be running such a risky and aggressive portfolio. Most of all, he seems to have been a bad manager of risk. There were lots of warning signs that the market’s enormous collapse was ending. Indeed, the biggest-since-1973 move to the downside was accompanied by all manner of signs that it had run its course. Every sentiment reading was pinned deep into the red: % of stocks below their 200 day moving average; new high/lows; insider buys/sells; market breadth; ARMS Index; downside volume; AAII Equity % of portfolios. From November 2008 to January 2009, Treasury yields dropped from 4% to 2%, then went negative in real terms. The VIX spiked to almost 90 late in 08; it was still over 50 in March 2009. Indeed, it was hard to find a rational reason to be short in March 2009 — except naked fear. Talk about the Recency effect! Anyone shorting equities in March 2009 after a 57%, 8,000 point Dow drop was looking backwards, not forwards. 57% down is not where you want to press your shorts, its where you cover and go long. Any student of market history could have shown you dozens of studies as to when you take short trades off the table. The chart below is just one such example of a typical secular bear market (it is a composite of 19 such bear markets). I am the last person in the world to be defending the banks, the Fed, Hank Paulson, Alan Greenspan, Ben Bernanke, Tim Geithner, et al, but Damn! Even if you didn’t get long, you must at least at some point cover your shorts. This is not Monday morning quarterbacking — we were short Bear, Lehman and AIG (to my everlasting shame, I failed to ride the latter two down to zero). The massive capitulation in March 2009 was accompanied by indiscriminate panic selling. Bailouts or not, that’s when you cover shorts and buy, due to all of the aforementioned indicators — and I said as much at the time. Forget the secret info; the bailouts, which I deplored, where at the very least short term bullish. Hartzman and his clients lost all that money because he made aggressive trades and ignored the overwhelming public data about market internals and sentiment, and ran unsuitable trades without the skillset to manage them.
Typical Secular Bear Market and Its Aftermath
Source: |
| Posted: 10 Jan 2013 03:30 AM PST www.thebubblefilm.com The Bubble is a feature length documentary that ask those who predicted the greatest recession since the Great Depression, why did it happen and what are we facing? The documentary is an adaptation of Tom Woods’ New York Times bestseller Meltdown. Filmmaker Jimmy Morrison is releasing each interview in full for free before the film’s release. James Grant originated the “Current Yield” column in Barron’s before founding Grant’s Interest Rate Observer in 1983. He is the author of five books on finance and financial history: Bernard M. Baruch: The Adventures of a Wall Street Legend (Simon & Schuster, 1983), Money of the Mind (Farrar, Straus & Giroux, 1992), Minding Mr. Market (Farrar, Straus & Giroux, 1993), The Trouble with Prosperity (Times Books, 1996) and Mr. Market Miscalculates (Axios Press, 2008). A sixth book John Adams: Party of One, a biography of the second president of the United States-was published in March 2005 by Farrar, Straus & Giroux. |
| How Did Professional Forecasters React to the August 2011 FOMC Statement? Posted: 10 Jan 2013 03:00 AM PST Making a Statement: How Did Professional Forecasters React to the August 2011 FOMC Statement?Richard Crump, Stefano Eusepi, and Emanuel Moench The Federal Open Market Committee (FOMC) statement released on August 9, 2011, was the first to incorporate language on "forward guidance" with an explicit date tied to the Committee's expected path of monetary policy. In this post, we exploit the timing of surveys taken before and after this statement's release to investigate how professional forecasters changed their expectations of growth, inflation, and monetary policy. We find that the average forecast of the federal funds rate shifts considerably and closely aligns with the new language in the statement, while the average forecasts for growth and inflation change less. While there's near unanimity among forecasters about the future path of the federal funds rate after the August 2011 FOMC statement, forecasters maintained differing views on the growth and inflation outlooks. The August 2011 FOMC statement included the following excerpt:
The phrase "at least through mid-2013" replaced the former language, which read "for an extended period." It's generally difficult to assess the change in expectations of professional forecasters before and after an event such as an FOMC meeting because surveys are relatively infrequent (generally, monthly or quarterly), whereas economic data and news are released much more often. In this instance, however, we can use data from two well-known surveys of professional forecasters to investigate this issue. The two surveys—the Blue Chip Financial Forecasts (BCFF) and the Blue Chip Economic Indicators (BCEI)—are conducted monthly and ask participants, ranging from broker-dealers to economic consulting firms, to provide forecasts of the future path of selected economic and financial variables. We take advantage of two aspects of the BCFF and the BCEI surveys: First, they were conducted relatively close to either side of the August 9, 2011, FOMC meeting; second, they have twenty-seven professional forecasters in common. This overlap essentially allows us to turn a monthly survey into a semi-monthly one, as shown in the following timeline: In addition to the BCFF surveys taken in late July and August and the BCEI survey taken in early August, the timeline makes special reference to the July 29 Advance GDP report. This report included "benchmark revisions" for real GDP back through 2007, and indicated that the output declines in late 2008 and early 2009 were even sharper than previously thought. Because this information likely had a significant impact on professional forecasters' expectations, it's important to control for its effect. We recognize, however, that the relatively long gap of approximately two weeks between the meeting and the BCFF survey is an impediment to our design. Over that period, there were other economic data releases and events occurring outside the United States that likely influenced expectations. We focus on two simple measures to characterize the distribution of forecasts across our twenty-seven forecasters: the mean across them (the "consensus" forecast) and the dispersion across them (forecaster "disagreement"). The latter measures the difference in opinions of professional forecasters at a given time. We examine disagreement because looking at the mean alone might not provide a complete picture of forecast changes. For example, small changes in consensus forecasts might mask significant and diverging changes in individual forecasts. The table below reports the consensus forecasts for real GDP growth as well as CPI inflation for the twenty-seven common participants in the two surveys and the overall consensus from each survey. We first note that the forecasts across the two groups are very similar, suggesting that the twenty-seven common forecasters are representative of the entire sample. The table also shows that consensus forecasts for 2012 annual GDP growth declined after the GDP release on July 29 as well as after the August 9 FOMC meeting, while the consensus forecast for 2012 inflation was little changed. In sharp contrast, consensus forecasts for the federal funds rate fell dramatically following the FOMC meeting, as shown in the chart below. Indeed, the consensus forecast of the rate from the BCFF survey of August 24-25 (the solid line) is consistent with the "forward guidance" language in the statement, as it remains slightly above zero through 2012. How much of this decline in policy rate expectations is attributable to the FOMC meeting? The next chart shows the shift in the forecast for the three-month Treasury bill after the GDP release (but before the FOMC meeting) and after the FOMC meeting. Because the BCEI doesn't collect forecasts of the federal funds rate, we use the Treasury bill forecast as a proxy. The chart suggests that the bulk of the stark drop in the rate forecasts from late July to late August didn't occur after the GDP release, but instead after the FOMC meeting. The next two charts relate to the issue of forecaster disagreement, and show three estimated distributions for 2012 GDP and CPI forecasts across our twenty-seven forecasters corresponding to the pre-GDP, pre-FOMC, and post-FOMC surveys, respectively. While the distribution of real GDP forecasts shifted sequentially toward slower growth, it also became more concentrated around the lower mean, indicating a modest decline in "disagreement," especially after the FOMC meeting. At the same time, the distribution of the inflation forecasts doesn't exhibit a shift in the consensus, but instead displays an increase in disagreement after the GDP release and after the FOMC meeting. In contrast to the GDP and inflation forecasts, the change in the forecast distribution for the federal funds rate is dramatic. The lines in the first chart above show the forecast in the 25th and 75th percentiles before (the blue line) and after (the red line) the FOMC meeting. These indicate that disagreement about the future path of the federal funds rate effectively vanished. In particular, while thirty-five of the forty-five participants in the survey before the FOMC meeting were expecting the rate to be above 0.3 percent in fourth-quarter 2012 (the longest forecast horizon available in the survey), the survey after the FOMC meeting saw only two of the forty-six participants submit forecasts for the federal funds rate above 0.3 percent for fourth-quarter 2012. One month later, only one of thirty-eight survey participants submitted a forecast for the rate above 0.3 percent for first-quarter 2013 (and none above 0.3 percent for fourth-quarter 2012). There was a similar compression in disagreement in the evolution of the Treasury bill forecast. Summing up, we note that the Blue Chip survey showed that the FOMC announcement in August 2011 produced a sizable effect on the participants' expected future path of monetary policy. Forecasts were revised in a manner that appears to be aligned with the FOMC's expected path as characterized in the "forward guidance" language of the statement. Forecasters also adjusted their GDP growth and CPI forecasts after the FOMC statement, but to a lesser degree. Unfortunately, we can't observe the counterfactual set of forecasts in a world where there was no change to the "forward guidance" language in the statement. Consequently, we can't determine whether professional forecasters perceived the new statement language as an effective tool to stimulate economic activity and affect inflation expectations. Disclaimer
Posted by Blog Author at 07:00:00 AM in Macroecon, Monetary Policy |


| You are subscribed to email updates from The Big Picture To stop receiving these emails, you may unsubscribe now. | Email delivery powered by Google |
| Google Inc., 20 West Kinzie, Chicago IL USA 60610 | |


0 comments:
Post a Comment