


The Big Picture |
- European Insertion/Extraction
- Global Retirement Dilemma
- ‘Judging the Judges’ and Your Takeaways for 2013
- Nasdaq 4000: Why This Time Is Different
- Econopolis Big Picture (really!)
- Guide to Stock Market Corrections
- Unless the Fed Goes Cold Turkey on Us, Expect a Bountiful Economic Harvest for Thanksgiving 2014
| Posted: 03 Dec 2013 11:21 PM PST A quick note before I head to the airport to fly home from Belgium (which will hopefully settle down markets). I write this from the Brussels Sheraton, just before I jump int he shower, head to the airport to fly back to JFK. I’ll write up some thoughts about Europe and what is going on here later this week. This is the 2nd time I have done a “Seal Team Six” visit in as many years — a less than 48 hour In/Out; I learned from my last visit. A 5:15pm flight from NY — with half a Lunesta — means I caught a nap on the way here. I arrive a midnight NY time, 6 am local. Unfortunately get stuck behind a literal planeload of Chinese tourists, delaying my way through Customs by 45 minutes. I am at the hotel by 7ish, where a big bed and the other half of the Lunesta allow me to grab another few hours sleep. Picked up at 11:30 for a lunch presentation and Q&A, I felt fairly functional. The problem with lack of sleep is the tendency towards incoherent rambling, a fate I thankfully avoided this go round. A mild headache accompanies the time-shifting, but its nothing that an aspirin cannot take care of. Back to the hotel to grab the MacAir, make minor changes in presentation, then off to the BMW HQ here for the evening festivities. Check out the i3 and i8 (where is mine?), a cocktail party (I drink tea) then my presentation (I’ll get that posted tomorrow). More drinks (coffee for me) then a debate amongst myself and 4 EU economists and journalists. Food afterwards (I allow myself half a glass of Bordeaux), then back to the hotel. A (OMG) whole Lunesta at 10pm local time –4 in the afternoon to my body clock) and a solid 7 hours later, I am typing this after breakfast, before I jump in the shower to catch my 10:30 flight home. I actually feel pretty good, though there is a sensation of mild buzzing. Whether that is the strong expresso or the time change (I am still on NYC time, so I doubt its jet lag) or whatever, I am aware that something is slightly amiss with my circadian rhythms. Hopefully I can grab some Zs on the plane. The human body is surprising in its ability to adapt . . . |
| Posted: 03 Dec 2013 11:30 AM PST click for ginormous graphic |
| ‘Judging the Judges’ and Your Takeaways for 2013 Posted: 03 Dec 2013 10:15 AM PST
When I look back on 2013, the primary capital markets theme that comes to my mind is the “don't fight the Fed” investing mantra. But with this already at the fore of investors' minds at the beginning of the year, what with QE 3 and the anticipation for the “great rotation” in place late 2012, the actual underlying theme for 2013 was more of a guessing game about what the Fed would do or say next. Therefore the key investing skill for 2013, if not any given calendar year, was not to judge the economy and capital markets accurately but to judge the judges accurately, even if you did not agree with their judgment. For example, if you guessed there would be no QE tapering this year, and invested accordingly, you would have likely over-weighted your stock allocation and participated in what may end up being the best year for stocks in 15 years. And under-weighting bonds was a prominent idea in 2013 but the “flight to equities” didn't exactly translate into a horrific exit from all fixed income securities. Who puts all of their fixed income eggs into one basket of high credit quality domestic bonds? And why must the financial media talking heads use the 10-year US Treasury Bond as its benchmark? A well-managed multi-sector bond fund, such as Dan Fuss' Loomis Sayles Bond (LSBRX), is up more than 4.50% as of this writing and covers a wide range of the bond universe from investment grade bonds to high-yield to foreign bonds. That's what I call total bond market. What Are Your Key Takeaways From 2013? The Fed’s calls were but one general market theme of 2013. Before sharing your 2013 takeaways, here are a few more of mine (or perhaps I should call them data points that are somewhat interesting or worthy of reflection before going into the New Year):
But these are some of the more obvious data points making year-end headlines now. I would like to know what critical points or interesting themes—small, large, good, bad, or ugly—you will take away from 2013 and carry with you into the next year. —————————————————————————————— Kent Thune is the blog author of The Financial Philosopher. You can follow Kent on Twitter @ThinkersQuill.
*Source: Bloomberg, Stocks Triumph for a Third Month While Bullion Tumbles |
| Nasdaq 4000: Why This Time Is Different Posted: 03 Dec 2013 08:30 AM PST Source: Yahoo Finance |
| Econopolis Big Picture (really!) Posted: 03 Dec 2013 06:00 AM PST I am in Brussels today (which I suspect will mean futures are down) for this event:
Should be fun! |
| Guide to Stock Market Corrections Posted: 03 Dec 2013 04:30 AM PST
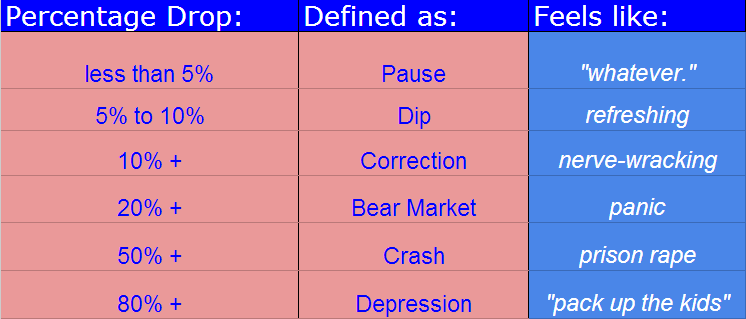
The S&P 500 hit 1709 a few weeks back and has since been dropping precipitously, we are now down roughly 3.7% from that level in a short period of time. Heading into today, we’ve been negative 4 days straight and have seen losses during 9 of the last 11 days on both the S&P 500 and the Dow Jones Industrial Average. Suddenly, everyone is talking about this being a correction. I would say that at the current moment, we are just barely in a dip but possibly headed toward a correction. Let’s first define some terms:
With a market pause that is not yet even a 5% dip – let alone a 10%+ correction – people (myself included) have been jumping the gun in trotting out the C-word so early. But for argument’s sake, let’s say we’re headed for a real correction…what should we expect? Today I’ll limit my remarks to price action and not get started into a whole discussion about news, valuations, or anything else. A handy field guide to stock market corrections below (data via Dow Jones, Morningstar, Bloomberg): * Since the end of World War II (1945), there have been 27 corrections of 10% or more, 12 of which had turned into full-blown bear markets (with losses of 20% +). * This equates to one correction roughly every 20 months, according to Dow Jones index maven John Prestbo, who points out that this average does not mean they’re evenly spaced out. 25% of these corrections over the last 66 years occurred during the 1970′s (the Golden Age of Market Timers), another 20% occurred during the secular bear market of 2000-2010. * The average decline during these 27 episodes has been 13.3% and they’ve taken an average of 71 days to play out (just over three months). * From the beginning of the last secular bull market in 1982 through the 1987 crash, there was just one correction of 10% or more. Between the Crash of 1987 and the secular bull market’s peak in March 2000, there were just two corrections, according to Ed Yardeni. This means that secular bull markets can run for a long time without a lot of drama. * Since the stock market’s bottom in March of 2009, there have been only 3 corrections: In the spring of 2010 the S&P 500 began a 69-day drop of roughly 16%. The widely referenced summer correction of 2011 lasted for about 154 days and almost became a bear market. The correction during the spring of 2012 set up one of the greatest rallies of all time, although it was barely a real correction, sporting a peak-to-trough drop of just 9.9% in just under 60 days. * The most recent correction took place in 2011, between the end of April into the end of September. The Dow dropped roughly 16%. The S&P 500 actually dropped a hair over 20% before snapping back, leading some to believe that this was a bear market – the implication being that the current bull market is just 2 years old and not five years old (dating from March of 2009). I have no strong opinion on that debate. * Bull market rallies in between corrections – and there have been 58 in the post-war period – tend to run for an average of 221 trading days before being interrupted and gaining an average of 32%. By this standard, we are way overdue for a correction (but in fairness, we have been for awhile). * As to what we should do during corrections, I’d recommend maintaining a list of high-quality stocks you’ve been kicking yourself for missing out on and clearing the decks of any longs you don’t truly love. For those with time horizons longer than five years (most), the best thing to do is grit one’s teeth and do very little. If a correction of between 10 and 20% is unbearable to you mentally or financially, that means you’ve either got more money than you should invested in stocks or you’re kind of a fairy. Make the adjustment you can live with and remember this feeling the next time you find yourself chasing the market. * As to the question of whether a correction could become a bear market (or worse even, a crash), the answer is that this is always possible. But most corrections do not become crashes, and every single one of them turned out to have been great buying opportunities in the fullness of time. * Lastly, remember your ABC’s: Always Be Cool. |
| Unless the Fed Goes Cold Turkey on Us, Expect a Bountiful Economic Harvest for Thanksgiving 2014 Posted: 03 Dec 2013 03:00 AM PST November 24, 2013
Unless the Fed Goes Cold Turkey on Us, Expect a Bountiful Economic Harvest for Thanksgiving 2014
If your Thanksgiving family dinner conversation is anything like mine this Thursday, it will be dominated by a discussion of how the U.S. economy and its financial markets will be behaving after nearly a year of Dr. Janet Yellen at the helm of the Fed. Well, I am going to give my family an advance copy of what I plan to say so that we can just concentrate on willing a Packers victory over the Lions. As a preview, I am bullish about what things will look like by Turkey Day 2014 even if Chairwoman Yellen becomes a little hawkish. (Perhaps too cute with the animal references?) Let me explain. Monetary policy is all about modulating nominal aggregate transactions. Monetary policy affects the amount of a certain kind of credit created in the economy — credit that is created, figuratively, out of thin air. An increase in this thin-air credit enables the recipients of it to increase their purchases of goods, services and/or assets – physical and financial – without necessitating anyone else to correspondingly reduce his current spending/transactions. Regrettably, there do not exist data of total transactions in the U.S. economy. But there is a measure calculated by the Bureau of Economic Analysis that is an estimate of the nominal dollar amount of expenditures by U.S. residents on currently-produced goods and services, some of which are produced domestically, some of which are produced abroad. This measure is called nominal Gross Domestic Purchases. Plotted in Chart 1 are year-over-year percent changes in quarterly observations of nominal Gross Domestic Purchases and the sum of Federal Reserve credit and depository institution credit from 1953:Q1 through 2013:Q2. As I have discussed ad nauseam in previous commentaries, both Fed credit and depository institution credit are created, figuratively, out of thin air. The measure of Fed credit included in the credit sum is another sum – the sum of Fed outright holdings of securities and Fed holdings of securities via repurchase agreements. The Fed's current Quantitative Easing (QE) policy involves increased outright acquisitions of securities. Depository institution credit consists of the loans and securities on the books of institutions that issue deposits redeemable at par – commercial banks, saving institutions and credit unions. Since the S&L crisis of the early 1990s and the financial crisis of 2008, commercial banks account for the overwhelming largest component of depository institution credit. Notice in Chart 1 that changes in the sum of Fed and depository institution credit, advanced by one quarter, has a correlation coefficient of 0.65 (out of a possible maximum of 1.00) with changes in the sum of nominal Gross Domestic Purchases. This correlation of 0.65 is higher than that obtained when the two series are compared on a coincident basis. This correlation is higher than that obtained when changes in nominal Gross Domestic Purchases is advanced one quarter relative to changes in the sum of Fed and depository institution credit. Thus, the evidence in Chart 1 suggests that not only do changes in nominal Gross Domestic Purchases and changes in the sum of Fed credit and depository institution credit move in close tandem, but also that changes in the sum of Fed and depository institution credit "cause" (in a statistical sense) changes in nominal Gross Domestic Purchases. Chart 1  Plotted in Chart 2 are year-over-year percent changes in the sum of Fed and depository institution credit along with changes in depository institution credit by itself. From 1953 through 2008, the year-over-year percent changes in both of these series were very close to being equal. This implies that from 1953 through 2008, up until the recent financial crisis and the advent of QE, the behavior of depository institution credit dominated the behavior of the sum of Fed and depository institution credit. In other words, the Fed was providing a relatively small amount of "seed money" for thin-air credit creation to depository institutions. Depository institutions, operating in a fractional required reserve monetary system, were "multiplying" this Fed seed money into a much larger amount of thin-air credit to the non-depository-institution public. Chart 2  Chart 3 shows this more explicitly. Depository institution credit as a percent of the sum of Fed and depository institution credit has a median value of 92.3% from 1953:Q1 through 2013:Q2. In 2013:Q2, this percentage had dropped to a low of 78.2%. As implied in Chart 3, following the financial crisis of 2008, the Fed has become a considerably larger provider of total thin-air credit as private depository institutions have had to restrict their thin-air credit creation because of capital constraints resulting from loan losses as well as increased regulatory capital requirements. Chart 3  Chart 4 shows the actual year-over-year percent change in quarterly observations of nominal Gross Domestic Purchases along with the predicted changes in the same. The predicted values were obtained from a linear OLS regression I ran with percent changes in nominal Gross Domestic Purchases as the dependent variable. The explanatory variables were a constant term, lagged percent changes in the sum of Fed and depository institution credit and lagged values of the percent changes in nominal Gross Domestic Purchases. Looks like a tighter fit than OJ's glove, eh? The adjusted R-squared for this regression is 0.87, which means that the explanatory variables "explain" 87 percent of the variation in percent changes in nominal Gross Domestic Purchases. Chart 4  Alright, so why am I bullish on nominal transactions for 2014? Because I am expecting the key "mover" of nominal transactions, the sum of Fed and depository institution credit, to average year-over-year growth from now through the end of 2014 slightly above its long-term median growth of 7.6% . Sustained growth in total thin-air credit of this magnitude has not occurred since the mid 2000s. I am making very conservative assumptions about the behavior of Fed credit and depository institution credit in my calculation of the projected sum of Fed and depository institution credit. I am assuming that the Fed will taper its net acquisitions of securities by $10 billion per month starting in January 2013 and taper further by another $10 billion per month starting in July 2014. In the 12 months ended October 2013, commercial bank credit increased 0.9%. I am assuming that depository institution credit will continue to grow at this modest rate. Chart 5 shows the actual year-over-year growth in the sum of Fed and depository institution credit from 2000:Q1 through 2013:Q2 and my projected growth in it from 2013:Q3 through 2014:Q4. The projected average year-over-year growth for the six quarters ended 2014 is 7.8%. Chart 5  Plugging these conservative projected growth rates for the sum of Fed and depository institution credit into my aforementioned regression, I obtained forecasts of year-over-year percent changes in nominal Gross Domestic Purchases from 2013:Q3 through 2014:Q4. These forecasts, along with actual percent changes in nominal Gross Domestic Purchases starting in 2000:Q1 are shown in Chart 6. Chart 6 Notice that the forecast shows a rising trend in year-over-year growth in nominal Gross Domestic Purchases in the (shaded) 2013:Q4 through 2014:4 period. For 2014:Q4, the year-over-year growth forecast for nominal Gross Domestic Purchases is 7.2%, the fastest year-over-year growth since 7.6% in 2005:Q4. Now, I do not view the point forecasts of nominal Gross Domestic Purchases as the Gospel. But I do believe that the projected rising trend in the growth of the sum of Fed and depository institution credit does portend a rising trend in the growth of nominal Gross Domestic Purchases. Moreover, I believe that my growth projections of the sum of Fed and depository institution credit are very conservative. Given the capital-raising campaigns undertaken by U.S. depository institutions in recent years, given the diminished uncertainty about future regulatory capital requirements and given the rising trend in residential real estate prices, I believe that depository institutions are more able to step up their credit creation. Lastly, if I have erred in my projection of Fed credit, I suspect I have erred on the side of restraint. It is not a done deal that the Fed will commence a tapering in its securities purchases in the December 2013 or January 2014, as I have assumed, especially given how low consumer inflation is. For example in the three months ended October, the All-Items CPI increased at a compound annualized rate of 0.8%; the CPI ex Food & Energy at 1.5%. If the Fed were to delay its initial round of tapering until March 2014, it also would likely delay its second round of tapering – i.e., initiating an additional amount per month of reduced securities purchases – until after July 2014. My projection of a rising trend in the growth of the sum of Fed and depository institution credit has a positive implication for the prices of U.S. risk assets – equities, high-yield bonds, real estate and maybe even commodities. The recipients of this projected rising trend of thin-air credit are going to purchase something with it. If the borrowers purchase currently-produced goods and services, this would result in higher corporate profits, which, in turn, would be positive for equities and high-yield bonds. The recipients of this increased supply of thin-air credit might purchase risk assets directly. After all, margin credit is on the rise. What my projection of a rising trend in the growth of the sum of Fed and depository institution credit has a distinctly negative implication for are the prices of investment grade fixed-income securities. The likely faster growth in nominal aggregate demand will have a "multiplier" impact on the effective demand for credit. That is, as growth in sales of goods and services increases, businesses will be induced to borrow more to expand the scale of their operations. Household creditworthiness will improve, inducing them to activate their latent demand for credit. Rising credit demand will put upward pressure on interest rates, especially interest rates on longer-maturity securities. Presumably, interest rates on short-maturity securities will be held in place by the Fed's continued zero-interest-rate policy (ZIRP). But, speaking of ZIRP, growth in nominal domestic aggregate demand higher than what the consensus and the Fed expect (is making a distinction between consensus expectations and Fed expectations a distinction without a difference?), which is my expectation, will cause the consensus to move up in time the forecast for the first Fed interest–rate hike and, therefore, revise up the level of the expected future course of short-term interest rates. This will put upward pressure on the current levels of longer-maturity interest rates. Lastly, stronger-than-expected growth in nominal domestic aggregate demand would likely result in an upward revision in inflation expectations, also putting upward pressure on the current levels of bond yields. So, as you gather around the dining table with your family this coming Thursday to enjoy your Thanksgiving feast, you can reflect on not only your good fortune in 2013, but look forward to an even more bountiful "harvest" at Thanksgiving 2014, thanks, in no small part, to the generosity of the Federal Reserve. But you might want to "put up" more of that expected bountiful 2014 harvest because the Fed's generosity will already have waned around the time of Thanksgiving 2014. The Fed is likely to become downright miserly soon thereafter, which implies that 2015 will be a much leaner year. Paul L. Kasriel Econtrarian, LLC Sturgeon Bay, WI |


| You are subscribed to email updates from The Big Picture To stop receiving these emails, you may unsubscribe now. | Email delivery powered by Google |
| Google Inc., 20 West Kinzie, Chicago IL USA 60610 | |


0 comments:
Post a Comment