


The Big Picture |
- The Impact of Unemployment Duration on Compensation Growth
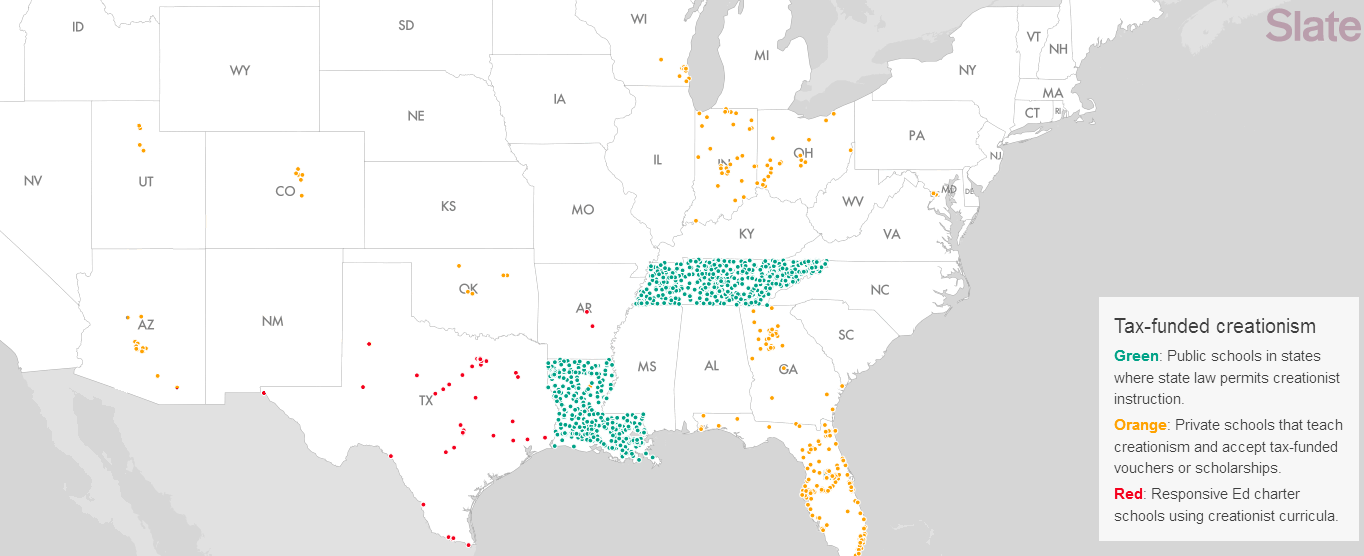
- Creationism in Public Schools Mapped
- Narrative Rules
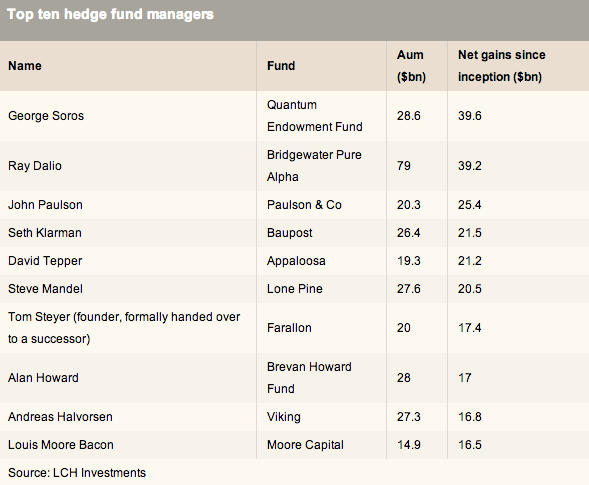
- All Time Top 10 Hedge Fund Managers
- 10 Thursday AM Reads
- Cadillac ELR: ‘Work Hard’
| The Impact of Unemployment Duration on Compensation Growth Posted: 14 Feb 2014 02:00 AM PST The Long and Short of It: The Impact of Unemployment Duration on Compensation Growth
How tight is the labor market? The unemployment rate is down substantially from its October 2009 peak, but two-thirds of the decline is due to people dropping out of the labor force. In addition, an unusually large share of the unemployed has been out of work for twenty-seven weeks or more—the long-duration unemployed. These statistics suggest that there remains a great deal of slack in U.S. labor markets, which should be putting downward pressure on labor compensation. Instead, compensation growth has moved modestly higher since 2009. A potential explanation is that the long-duration unemployed exert less influence on wages than the short-duration unemployed, a hypothesis we examine here. While preliminary, our findings provide some support for this hypothesis and show that models taking into account unemployment duration produce more accurate forecasts of compensation growth. The hypothesis that individuals who are unemployed for long durations have less impact on the behavior of wages than the recently unemployed is not new. Insider-outsider models make this prediction, and a paper by Ricardo Llaudes finds strong support for this proposed explanation in data for European countries. What is new is the relevance of this hypothesis for movements in wage rates in the United States. In particular, conventional models—such as Phillips curve models—have generally underpredicted compensation growth since 2009. These models typically rely on the total unemployment rate as the measure of labor market tightness. If the long-duration unemployment rate has limited impact on the compensation growth process, then its relatively large share in the unemployment rate in recent years could account for the underprediction of standard Phillips curve models. The chart below plots the total, long-duration, and short-duration unemployment rates, with the division between short- and long-duration unemployment defined, respectively, by unemployment spells of 26 weeks or less and 27 weeks or more. Until the past few years, the U.S. experience has been that most fluctuations in the total unemployment rate were driven by the short-duration unemployment rate. The average of the long-duration unemployment rate was only 1.0 percent from 1960:Q1 to 2007:Q4, with deviations around the average fairly muted and short-lived. However, the long-duration unemployment rate rose to over 4.0 percent during 2009-10, and by December 2013 has only moved down to 2.6 percent. So, is it important to distinguish between short-duration and long-duration unemployment in the United States? In a recent study, Robert Gordon of Northwestern University uses a Phillips curve model to examine the behavior of price inflation from the early 1960s through early 2013. His findings indicate that short-duration unemployment has a much greater impact on price inflation than does long-duration unemployment. Further, out-of-sample forecasts using short-duration unemployment track price inflation much more closely than those based on the total unemployment rate, especially during the post-2008 period. Our analysis complements the recent work of Gordon and offers some evidence on the robustness of his results by looking at compensation growth, as well as by specifying a different Phillips curve model and by examining a shorter sample period that runs from 1997 through the present. In a conventional compensation Phillips curve model, the indicator of resource utilization is the unemployment gap, measured as the difference between the unemployment rate and the non-accelerating inflation rate of unemployment (NAIRU). Conceptually, if the economy were operating with the unemployment rate at NAIRU, inflation would not have a tendency to either increase or decrease. Positive values of the unemployment gap indicate excess supply conditions in the labor market which should put downward pressure on compensation growth (and vice versa). We compare forecasts of compensation growth using two alternative measures of the unemployment gap—one based on the total unemployment rate and another based on the short-duration unemployment rate. The total unemployment gap measure is the difference, measured in percentage points, between the total unemployment rate and the Congressional Budget Office (CBO) estimate of NAIRU. The short-duration unemployment gap is constructed as the difference between the short-duration unemployment rate and our estimate of the short-duration NAIRU. The latter is the CBO estimate of NAIRU less the average of the long-duration unemployment rate calculated over the 1997-2007 period. As shown in the chart below, there had been a very close correspondence between the two unemployment gaps until the onset of the most recent recession. Currently, the total unemployment gap indicates a large amount of slack in the labor market, while the short-duration unemployment gap indicates little, if any slack. Following an earlier post on compensation growth, we specify a nonlinear compensation Phillips curve model (see this paper by Fuhrer, Olivei, and Tootell for a discussion of modeling the nonlinearity). The model relates the four-quarter growth rate in compensation per hour in the nonfarm business sector, relative to trend productivity growth and long-run inflation expectations, to resource utilization. For trend productivity growth, we use a twelve-quarter moving average of the (annualized) quarterly growth rate of productivity. For expected inflation, we construct a measure for the personal consumption expenditure index (PCE) by adjusting the Survey of Professional Forecasters ten-year expected CPI inflation series to account for the usual differential between CPI and PCE inflation. As in our previous post, we focus on the post-1997 period because it represents a low-inflation environment, based on the level and stability of the expected inflation series, and because we believe the nonlinearity may be especially relevant in such an environment. We examine both the within-sample fit and out-of-sample forecasts of the models to evaluate the alternative unemployment gap measures. The out-of-sample forecast performance is based on estimation of the model using data through 2007:Q4. With the resulting estimated model, we input the actual values of the unemployment gap, trend productivity growth, and expected inflation series for the post-2007:Q4 period to generate forecasts of compensation growth. The first forecast corresponds to compensation growth from 2008:Q1 to 2009:Q1. The next chart plots the four-quarter change in compensation growth, the within-sample fit of the models through 2007:Q4, and the post-2007:Q4 out-of-sample forecasts. Not surprisingly, the within-sample fit of the two models is very similar due to the two unemployment gap measures closely tracking each other during this period. The out-of-sample forecasts, however, reveal the different implications of the two unemployment gap measures. While the compensation growth series displays some volatility and both models missed the initial slowing and subsequent rebound in the series, the forecast using the short-duration unemployment gap does a better job tracking the subsequent movements in compensation growth and is about 10 percent more accurate than the forecast that ignores the duration of unemployment. The graph also illustrates that the forecast using the total unemployment gap have consistently underpredicted compensation growth, a feature shared by price-inflation Phillips curve models. Although they are not shown, we obtain similar results if we start the out-of-sample forecasts in 2004:Q4. Our results raise an interesting question—why has the distinction between short-duration and long-duration unemployment in the United States previously received so little attention? One answer is that the close correspondence between the total unemployment rate and the short-duration unemployment rate has masked the importance of the latter variable. If movements in the unemployment rate are largely driven by the short-duration unemployment rate, then the unemployment gap is a suitable proxy for measuring slack in the labor market—even if the appropriate measure is the short-duration unemployment gap. It is only since the last recession and its aftermath, when the composition of the total unemployment rate deviated from its historical pattern, that we can observe the differential effects of unemployment duration on compensation growth. Disclaimer
|
| Creationism in Public Schools Mapped Posted: 13 Feb 2014 04:00 PM PST
|
| Posted: 13 Feb 2014 09:15 AM PST After a string of up days, most markets were showing red earlier today. We never know what the daily action of the markets will look like in advance. Whether you want to call it a random walk or the madness of crowds, those of us who toil in the capital markets can rely on no two days being the same. However, one thing that occurs regardless of circumstances, data or specific events: The endless attempts made to explain the day-to-day in a narrative format. This futile gesture seems to occur regardless of the overall circumstances. Investors want an explanation that gives them comfort, even if their portfolio fails to do so. Hence, our love affair with the "if-that” news dynamic. IF this occurred, then THAT was the natural reaction in the markets. One of the few guarantees that can be made in investing is that you will be subject to an endless stream of this sort of explanation. Continues here |
| All Time Top 10 Hedge Fund Managers Posted: 13 Feb 2014 08:00 AM PST
|
| Posted: 13 Feb 2014 06:00 AM PST The reading
What are you reading?
S&P 500 Earnings (Inflation-Adjusted)
|
| Posted: 13 Feb 2014 03:00 AM PST Nice looking Hybrid Electric car: It could give Tesla a run for their money. ~~~ Caddy created a clever little commercial:
Learn more about the first ever Cadillac ELR See also |


| You are subscribed to email updates from The Big Picture To stop receiving these emails, you may unsubscribe now. | Email delivery powered by Google |
| Google Inc., 20 West Kinzie, Chicago IL USA 60610 | |


0 comments:
Post a Comment