


The Big Picture |
- A College Education Saddles Young Households with Debt, but Still Pays Off
- Sizing Up a Potential Media Marriage
- 10 Thursday PM Reads
- Which disease is most likely to kill you across the planet?
- 10 Thursday AM Reads
- Rupert Murdoch and The Dumbest Chart in the World
- Graphic Language: The Curse of the CEO
| A College Education Saddles Young Households with Debt, but Still Pays Off Posted: 18 Jul 2014 02:00 AM PDT A College Education Saddles Young Households with Debt, but Still Pays OffDaniel Carroll and Amy Higgins
Many parents believe their children must get a college degree—especially if they want to have at least as comfortable a lifestyle as their parents had; yet the price of a college degree has been rising rapidly over the past three decades. As costs have risen, more and more students and their families have turned to education loans for financing. This trend, combined with the strong propensity for households to form among individuals of similar education levels, has led to much larger student loan debt burdens for households headed by young adults who have attended college. In the 1989 Survey of Consumer Finances, real (inflation-adjusted) average student loan debt for young households (those headed by someone between 22 and 29 years of age) with a college degree was $3,420. In 2010, the same average was $16,714, nearly a 400 percent increase. For households with some college, but without a college degree, average student loan debt rose about 270 percent.
While it has become more costly to attend college, the extra education typically awards a benefit in the labor market. Households headed by an individual with a college degree earn, on average, a skill premium relative to non-college households. Real wage earnings for young households, for example, have consistently been higher for households with a college degree than for those without. In 2010, the median young household headed by a college graduate earned $42,693 in wage income while the median non-college household earned only $26,429, a premium of 61.5 percent. From 1989 to 2010, this premium averaged 45 percent. For young households with exceptional labor market outcomes—those in the 90th percentile of wage income within each level of educational attainment—the wage-income premium averaged 39 percent. In 2010, the difference in the 90th percentile of wage income between young college and non-college households was $85,387 and $64,040, respectively.
The labor market bonus for completing a college degree is not fully realized in the early years of working. Looking at the wage income of households headed by an individual between 30 and 65 years of age reveals a much larger premium, both at the median and the 90th percentile. In many professions, a college degree combined with work experience opens the door to senior-level administrative positions and higher salaries. The average wage-income premium among these older households was 88 percent for degree-holding median earners and 93 percent for 90th percentile earners.
In light of these data, the tradeoff seems clear. By going to college, one is likely to end up in a household that earns a considerable wage income premium throughout its working life but which also has a sizeable amount of college debt early on. There is one education group for which this does not hold: those with some college but no degree. These households, which on average make up 32 percent of those 22 to 29 years of age and 25 percent of those 30 to 65 years of age, have some college debt but get little to no labor market benefit. For young households with some college but no degree, the wage income premium is virtually zero, averaging -3 percent for median earners and 5 percent for 90th percentile earners. Only a very small premium emerges later in life. Among older households, the average premium was 22 percent at the median and 17 percent at the 90th percentile. Source: Federal Reserve Bank of Cleveland |
| Sizing Up a Potential Media Marriage Posted: 17 Jul 2014 05:00 PM PDT
|
| Posted: 17 Jul 2014 01:30 PM PDT My afternoon train reads :
What are you reading?
After Dizzying Rally, REITs May Be Overheating
|
| Which disease is most likely to kill you across the planet? Posted: 17 Jul 2014 09:30 AM PDT
|
| Posted: 17 Jul 2014 07:11 AM PDT My morning train reads (Continues here):
|
| Rupert Murdoch and The Dumbest Chart in the World Posted: 17 Jul 2014 06:30 AM PDT Yesterday morning, we learned of Rupert Murdoch's bid for Time Warner for as much as $85 dollar a share, or more than $75 billion. Soon after, the annotated chart below showing the Standard & Poor’s 500 Index began circulating on trading desks and websites, suggesting Murdoch’s offer signaled a market top.  It is such a misleading piece of statistical tripe that it cried out for a rebuttal. It is a prime example of confirmation bias writ large, another in a long line of weak analyses, wishful thinking and intellectual laziness that pollutes the Web. There are numerous ways to debunk this bilge water, but for brevity's sake, I will limit my wrath to a few quick lines of attack: Cherry picking, bad correlations, small data set, and randomness. If Twenty-First Century Fox chief Murdoch only made three acquisitions, and they all occurred at or near market tops, the chart would be much more interesting. Of course, Nassim Taleb would then wag his finger at you, warning that you are being fooled by randomness. Your pattern recognition sub-routine is again deceiving you. Continues here |
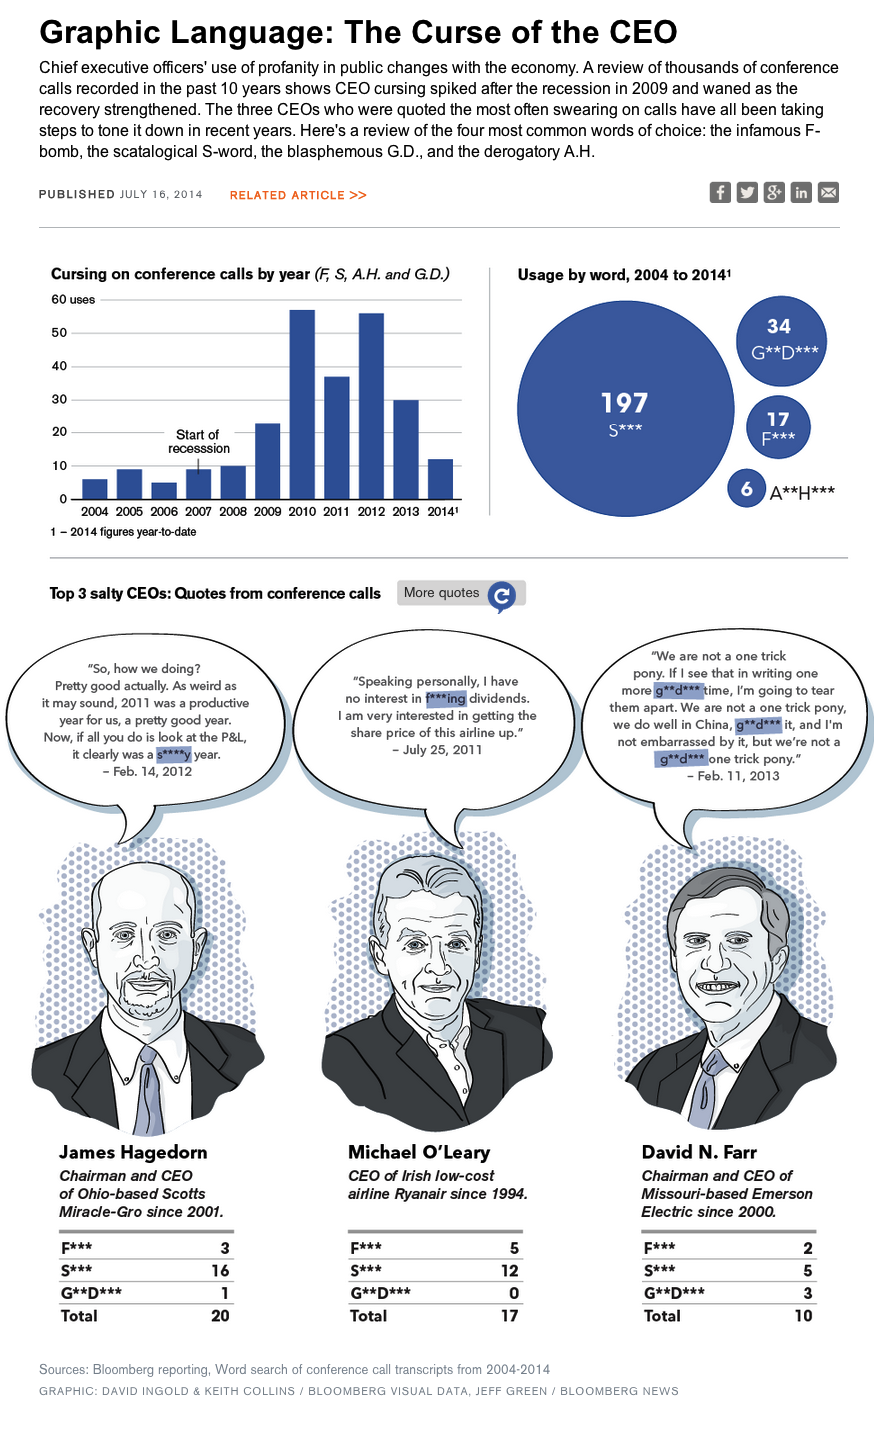
| Graphic Language: The Curse of the CEO Posted: 17 Jul 2014 03:00 AM PDT I love this article: F-Bombs Tolerated in Recession Cause CEOs Trouble Later
Lesson learned . . .
|


| You are subscribed to email updates from The Big Picture To stop receiving these emails, you may unsubscribe now. | Email delivery powered by Google |
| Google Inc., 20 West Kinzie, Chicago IL USA 60610 | |


0 comments:
Post a Comment