


The Big Picture |
- The Effect of Oil Price Declines on Consumer Prices
- 2014 On Pace for Hottest Year
- 10 Thursday PM Reads
- Winner Take All in Asset Management
- World’s Total AuM = Record $68.7 Trillion
- 10 Thursday AM Reads
- U.S. Debt Held by Foreigners Hits Record $6.07 Trillion
| The Effect of Oil Price Declines on Consumer Prices Posted: 21 Nov 2014 02:00 AM PST The Effect of Oil Price Declines on Consumer Prices
Oil prices have declined significantly in recent weeks, reaching levels not seen in several years. At the same time, the year-over-year percent change in the most widely known measure of inflation, the Consumer Price Index (CPI), came in at 1.7 percent for September, which is below policymakers' targeted levels. Given these circumstances, there is some concern that low oil prices, which have continued to remain below $90 a barrel through October, will keep inflation persistently below or even push it further from targeted levels. A look at historical relationships between oil prices and various price measures can help gauge the potential pass-through of the recent oil-price declines to other domestic prices. Historically, international and domestic oil prices have moved closely together—until recently there had been 25 years of nearly identical price movement. (Brent crude is the measure of international oil prices, while West Texas intermediate is the measure of domestic oil prices.) However, at the start of 2011 they began to deviate slightly from one another. In October, oil prices fell significantly, resulting in some of the lowest international barrel prices since 2010, and the two crude benchmarks began to converge to the same price path.
Given that oil prices and gasoline prices move closely together, low oil prices will directly affect the CPI through its energy component. The close comovement of the CPI energy index and oil prices can be seen below. However, much like the PPI, the energy CPI began to trend much closer to oil prices following the $60 threshold of 2007.
Since the CPI is most directly influenced by oil price changes through its energy component, one question that remains is whether or not other components in the CPI are influenced by low oil prices. Generally, energy prices are rather volatile, and so energy components are often excluded when predicting inflation because of that volatility. Forecasters focus on "core" measures instead. The recent decline in oil prices is of less concern to many CPI forecasters, because it may not affect the "core" price level. It would be a bit more concerning, however, if low oil prices also affected other domestic prices as well. A quick look at the year-over-year percent changes in the energy CPI and the CPI excluding energy suggests changes in energy prices are often followed by similar changes in the rest of the CPI's components.
We can take a more detailed look at how changes in energy prices might affect the nonenergy parts of the CPI by looking at the correlation between the CPI energy index and the indexes for other CPI components. The resulting correlations point to two components that are significantly correlated to energy price swings—food and beverages and housing—though the strength of these relationships has fluctuated over time. However, the relationship between energy and other components of the CPI is weak and, in some cases, even negative. Looking at the "all-items" or "headline" CPI suggests that the relationship between it and the energy index is strong, but this, again, is primarily because the energy component exerts such a strong influence in the overall CPI. It does explain why changes in energy prices can substantially change the headline CPI numbers. Correlations between the CPI Energy Index and Other CPI Component Indexes
Note: Correlations are between the year-over-year percent changes in each index.
Oil price changes can potentially play a large role in the US economy. With respect to inflation, the two most likely channels through which they could do so are retail gasoline prices and producer prices. However, as consumers use savings from lower energy prices for other goods and services, these prices are likely to rise in response, offsetting the initial disinflationary impact of lower oil prices. Accordingly, as the FOMC observed in its Statement on Longer-Run Goals and Monetary Policy Strategy, "the inflation rate over the longer run is primarily determined by monetary policy," rather than by movements in individual price components. | ||||||||||||||||||||||||||||||||||||||||||||||||||||||||||||||||||||||
| Posted: 20 Nov 2014 04:30 PM PST This is very impressive: | ||||||||||||||||||||||||||||||||||||||||||||||||||||||||||||||||||||||
| Posted: 20 Nov 2014 02:00 PM PST My afternoon train reads:
What are you reading?
Corporate Profit Margins vs. Wages
| ||||||||||||||||||||||||||||||||||||||||||||||||||||||||||||||||||||||
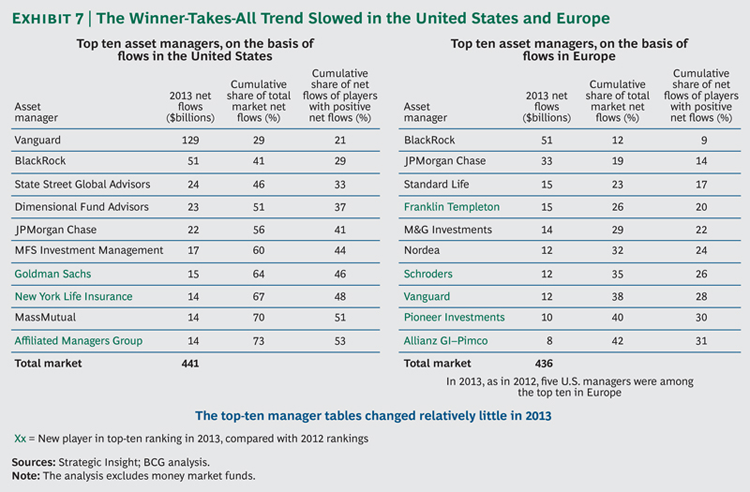
| Winner Take All in Asset Management Posted: 20 Nov 2014 11:30 AM PST As a follow up to this morning’s article on global AUM, have a gander at this interesting league table from BGC:
| ||||||||||||||||||||||||||||||||||||||||||||||||||||||||||||||||||||||
| World’s Total AuM = Record $68.7 Trillion Posted: 20 Nov 2014 09:32 AM PST Boston Consulting Group has a new report out concluding that, "The asset management industry has achieved its strongest year of growth since the onset of the financial crisis." As always, the consulting firm’s annual report on global asset management is a dry, number-laden and utterly fascinating look at the business of overseeing money. Ignore the boring title, “Global Asset Management 2014: Steering the Course to Growth” and instead focus on the cold, hard dollars. They are enormous, beyond big. In 2013, managed assets rose to a record $68.7 trillion. This year is on pace to see a further increase. Before the financial crisis in 2007, total assets were $54.7 trillion. Considering all that has occurred in the intervening years, the asset management business looks quite healthy. Check the following chart: Net revenue rose 11 percent, edging past the 2007 total. Profit rose as well, to $93 billion, a 17 percent gain from 2012, though still lower than 2007.
| ||||||||||||||||||||||||||||||||||||||||||||||||||||||||||||||||||||||
| Posted: 20 Nov 2014 05:30 AM PST Looks like a bumpy ride today, as futures soften, the Yen falls, and gold catches a bid. Enjoy them all with morning train reads:
| ||||||||||||||||||||||||||||||||||||||||||||||||||||||||||||||||||||||
| U.S. Debt Held by Foreigners Hits Record $6.07 Trillion Posted: 20 Nov 2014 03:30 AM PST |
 The most direct impact that low oil prices, both domestic and international, have on other domestic prices is through a decline in retail gasoline prices. While oil prices and gasoline prices follow the same trend, gasoline prices react with a delay to changes in oil prices. Gasoline prices have been trending around $3.50 a gallon for a few years, a level much higher than before the recession, but by the end of October, they had declined to $3.14 a gallon.
 In broader terms, one way in which we might expect oil prices to influence aggregate domestic prices is by lowering firms' costs of production. An indicator in which this effect would show up is the Producer Price Index (PPI), which measures the change in the selling prices received by domestic producers for their output. As production costs go down, firms can lower the prices they charge for their produced goods. The year-over-year percent change in the PPI for finished goods has been loosely related to international oil prices for the past 20 years. But when oil reached $60 a barrel in 2007, the two price series began to move more in sync. The year-over-year percent change in the PPI was lower in the most recent data release, but it is still too early to tell whether low oil prices are going to feed through to the PPI going forward.


| You are subscribed to email updates from The Big Picture To stop receiving these emails, you may unsubscribe now. | Email delivery powered by Google |
| Google Inc., 1600 Amphitheatre Parkway, Mountain View, CA 94043, United States | |


0 comments:
Post a Comment