


The Big Picture |

- Inflation and Stocks
- Succinct Summations of Week’s Events (May 24 2013)
- Nikkei Downtrend (1982-Present)
- Romancing Alpha, Forsaking Beta
- 10 Friday AM Reads
- Random Thoughts: Comebacks, Intraday Reversals and the like
- Paul Tudor Jones: Why There Are So Few Women Traders
- It Takes a Regime Shift: Japanese Monetary Policy Through the Lens of the Great Depression
- Star Formation in Orion Nebula
| Posted: 25 May 2013 02:00 AM PDT Inflation and Stocks
Inflation is not on the radar anymore. We do hear occasional comments from central bankers who warn about future inflation arising from QE. We also recall a few statements in the media along the lines of, “They’re printing all this money, we’re going to have huge inflation, and interest rates are going to shoot up.” We have been on the low-inflation side of that debate for years. We have supported the argument that there is a huge overhang of surplus capacity in the global labor force and that inflation is not a problem when labor income is flat, falling, or not rising robustly. This coincides with a wounded credit multiplier and a damaged financial credit system, conditions that have existed for the last five years. They are gradually improving, but only gradually. They are conditions that cause deflationary pressures. Will we have deflation? We are not certain. The forces at work globally that could bring on deflation are being blunted by the huge quantitative easing (QE) being undertaken by most major central banks. Let’s take a quick look at the US. All important measures of inflation in the US are on downward trends. Many thanks to Credit Suisse’s Neal Soss and Jay Feldman for a recap of the data in their research note of May 17. They report Core CPI, Cleveland Fed Median CPI, Cleveland Fed Trimmed Mean CPI, Core PCE, and Dallas Fed Trimmed Mean PCE. All are trending downward, as measured on a year-over-year basis, and those trends are accelerating. Commodities are also on downward price trends. So are the more esoteric inflation measures like market-based indices and chained indices. In the case of the Core PCE, which is believed to be the Federal Reserve’s preferred measure, the rate of inflation measured year-over-year is approaching one percent. Remember that the Fed’s threshold for any change in monetary policy is two percent. And Fed communications have suggested that a rate of 2.5 percent would be the threshold for any action taken to alter QE for the purpose of improving the employment statistics. So we are a full point and half away from that threshold, and the trend is in the opposite direction. The Fed’s stated unemployment threshold is 6.5 percent on the traditional headline unemployment rate (U-3). The Fed has also talked about other elements in the employment statistics, suggesting that the U-3 unemployment rate is not the only target measure for restoring the US to a more robust recovery. The charts and graphs that we have posted on our website and released in speeches present the employment statistics in a variety of ways that may be useful. Other measures, such as the U-6 broad-based unemployment rate, Beveridge Curve analysis, and the disaggregation of employment data, all point to a very large underutilized labor force in the US. The same seems to be true for most of the rest of the world. Our conclusion is that inflation is not a problem now and is not likely to become a problem soon. In fact, if certain indicators of inflation continue to head downward, they could trigger a reaction by the Fed because the risk of deflation will be perceived to be rising. Is deflation a threat today? The answer seems to be no. More likely, we are in a period in which the rate of inflation will be too low to be a problem and will gradually turn higher over several years as additional stimulative policies unfold worldwide. Meanwhile, low inflation is a very healthy environment for the stock market. It means that inflation distortions in reports of earnings are nearly nonexistent. That implies that the quality of earnings reports is very high, since they do not contain the distortions that occur in accounting systems when inflation is high. Higher-quality earnings justify higher price/earnings multiples and higher stock prices. There is a consistent linkage between very low inflation and very strong asset pricing. This is particularly so when interest rates are very low and likely to stay low for a very long time. We remain bullish. Inflation statistics support that outlook. They also support a gradual change in the outlook for bonds. Eventually, bond yields will be higher, maybe much higher, but the process is a gradual one. That means some tactical hedging in bond portfolios is appropriate. Panic selling of bonds is not. ~~~ David R. Kotok, Chairman and Chief Investment Officer, Cumberland Advisors |
| Succinct Summations of Week’s Events (May 24 2013) Posted: 24 May 2013 01:00 PM PDT Succinct Summations for the week ending May 24. Very light data week despite all the noise. Positives:
Negatives:
Thanks, Mike! |
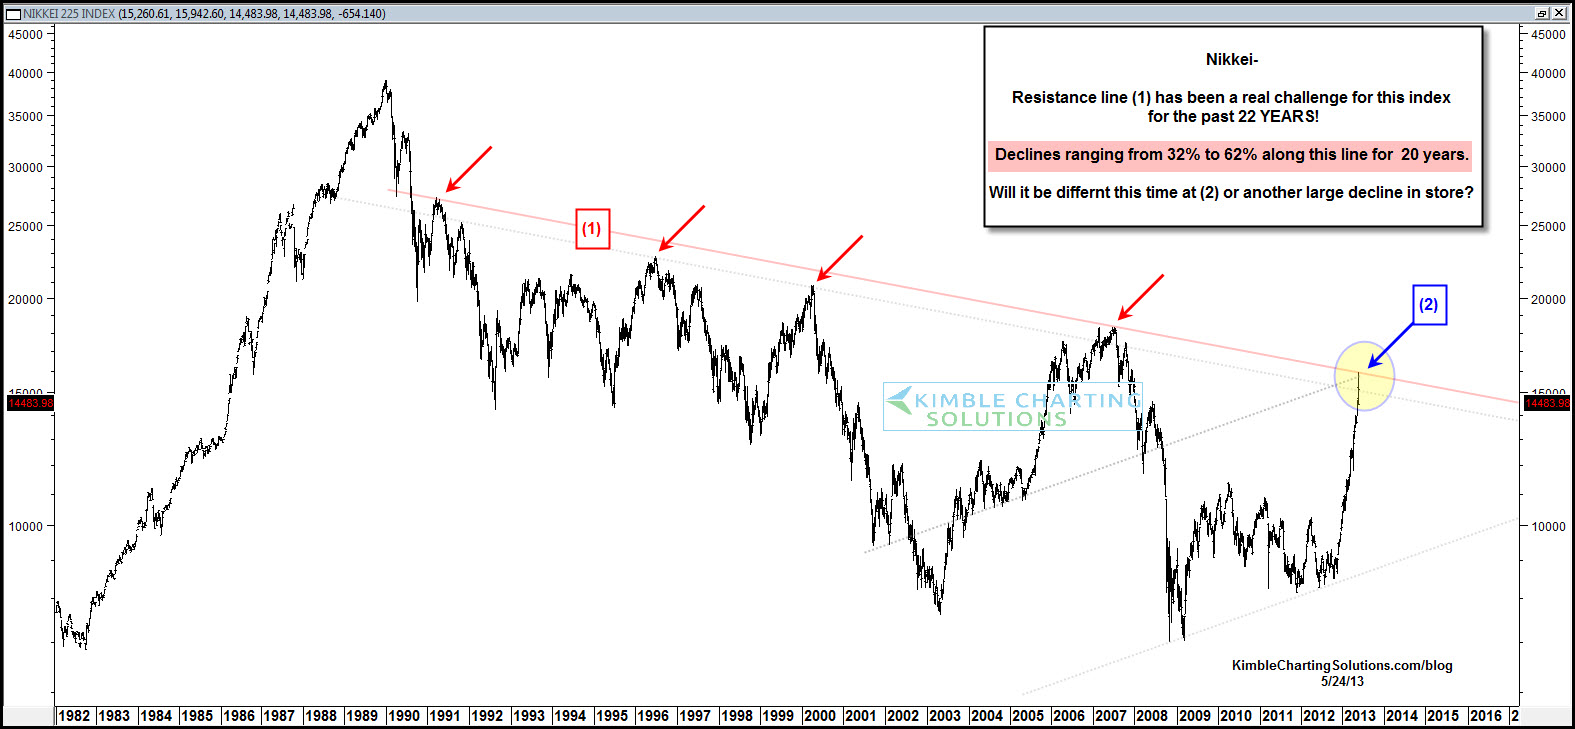
| Nikkei Downtrend (1982-Present) Posted: 24 May 2013 09:30 AM PDT click for ginormous chart
Awesome chart from Chris Kimble showing the Nikkei going back to 1982 — in particular, the downtrend that began in 1989 and still persists to this day. Chris notes that Declines of 32% to 60% taken place at this level for the past 20 years! One would normally expect a pullback and consolidation after a long move up to a major trendline, and under pre-Abenomics stimulus, that would be my highest probability outcome (pre-stimulus, I have no idea!). The key here is if and when the Nikkei breaks through that trendline, it is likely the beginning of a longer term multi-year breakout. This is why we put on Japan exposure for clients much earlier this year.
~~~ Disclosure: Clients are long GAL, DXJ, which have substantial exposure to Japan. |
| Romancing Alpha, Forsaking Beta Posted: 24 May 2013 07:30 AM PDT This is the presentation I gave at the IPI yesterday: |
| Posted: 24 May 2013 06:45 AM PDT It does not look like the best weather this weekend, so I expect to be around to keep you entertained:
What are you reading?
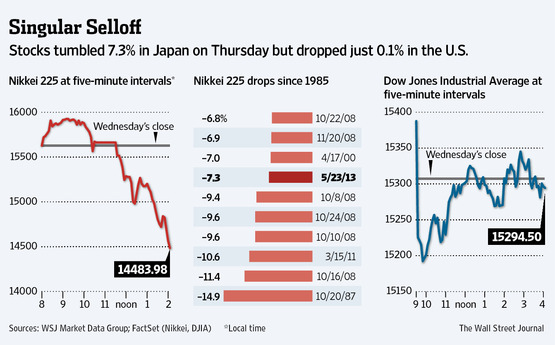
World Shakes Off Nikkei’s 7.3% Plunge |
| Random Thoughts: Comebacks, Intraday Reversals and the like Posted: 24 May 2013 05:25 AM PDT Since it is a Friday before a 3 day holiday weekend, it is a good time to kick back, and think about what the recent market action might (or might not) mean.
Identifying the cognitive errors we make is only the first step; Developing a way to respond to them, preventing this aspect of our personalities from affecting investing decisions is an ongoing, indeed, never-ending process. What are you doing to prevent your biases and emotions from getting in your own way? |
| Paul Tudor Jones: Why There Are So Few Women Traders Posted: 24 May 2013 04:00 AM PDT Ouch! There is a valid point to be made about emotions in Trading, but it gets lost in the sauce here: At a University of Virginia symposium in late April, Paul Tudor Jones responded to a question about why the panel only featured "rich, white, middle-aged men." Tudor responded by saying that trading requires intense focus, which he believes many women lose when they have children. The panel featured (from left to right) U-Va. professor David Mick, Paul Tudor Jones of Tudor Investment Corporation, Julian Robertson of Tiger Management, John Griffin of Blue Ridge Capital and moderator Jeff Walker, chairman of the U-Va. Council of Foundations Paul Tudor Jones comments on the lack of female traders |
| It Takes a Regime Shift: Japanese Monetary Policy Through the Lens of the Great Depression Posted: 24 May 2013 03:00 AM PDT |
| Star Formation in Orion Nebula Posted: 24 May 2013 02:00 AM PDT Click to enlarge |

| You are subscribed to email updates from The Big Picture To stop receiving these emails, you may unsubscribe now. | Email delivery powered by Google |
| Google Inc., 20 West Kinzie, Chicago IL USA 60610 | |


0 comments:
Post a Comment