


The Big Picture |
- World Bank: Global Economics Prospects
- Blog Finance: Advertising, Sponsorship, Advertorial, Subscription?
- 10 Mid-Week PM Reads
- Jon Hilsenrath to Rick Santelli: “This is What Journalism Is…“
- The Cost of Cash
- 10 Mid-Week AM Reads
- Time, Time, Time Is On Your Side (Yes it is)
- Equity Market Review for June 18th 2013
| World Bank: Global Economics Prospects Posted: 20 Jun 2013 02:00 AM PDT |
| Blog Finance: Advertising, Sponsorship, Advertorial, Subscription? Posted: 19 Jun 2013 05:15 PM PDT In light of that incidence last week with those terrible pop up ads, I have a question for the assembled multitudes: Running the blog at this point requires a decent amount of expenditures. Hosting, editorial assistance, research all costs some shekels, and that cost is covered with the current advertisers. I keep getting pitched on “Advertorials” but I have precisely zero interest in that. And I have done the Subscription thingie, and it holds little appeal to me. That pretty much leaves Advertising or Sponsorship. If we stay with the advertising, it would mostly continue to be the current rotating list of finance related and luxury brands you see. I think I want to kill the Google Adsense. (I thought I killed those terrible text ads, but they keep returning like Herpes). The sponsorship route is less noisy, but it means the site is pretty much “The Big Picture Sponsored by Ferrari NA“, or more likely, some finance related entity like Blackrock or Vanguard. Perhaps a less intrusive combination of sponsorship and advertising is possible. Any thoughts, feedback, ideas? |
| Posted: 19 Jun 2013 01:30 PM PDT My afternoon train reads:
What are you reading?
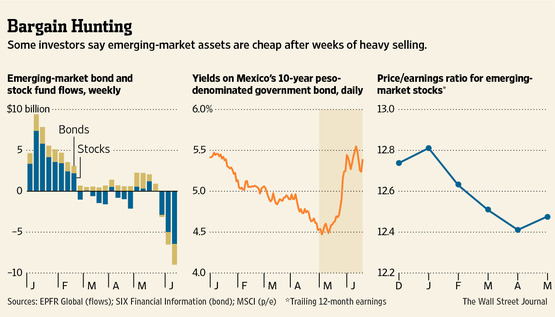
Emerging Markets Still Offer a Lure |
| Jon Hilsenrath to Rick Santelli: “This is What Journalism Is…“ Posted: 19 Jun 2013 01:00 PM PDT See if you can identify which person engages in sensationalism and which does real journalism.
Hat tip Business Insider |
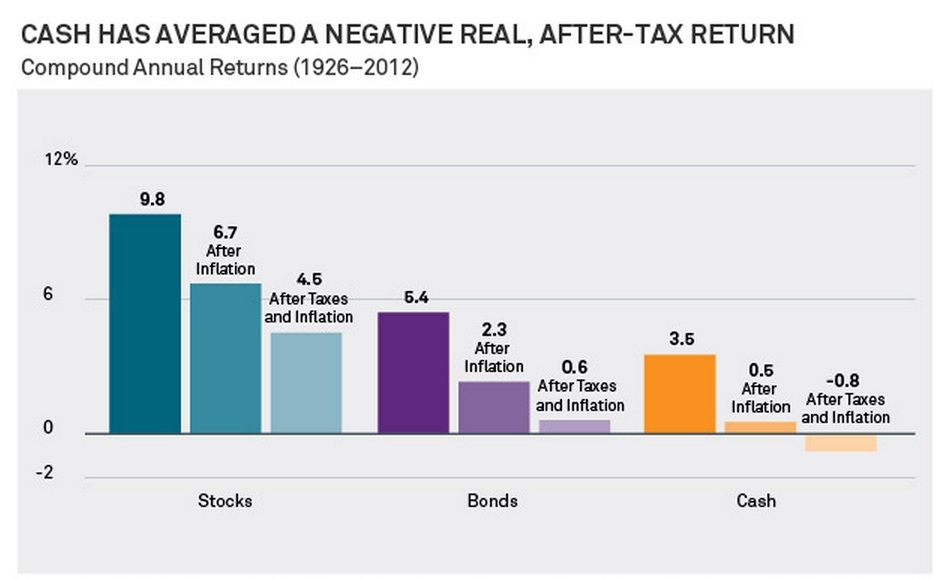
| Posted: 19 Jun 2013 09:00 AM PDT I am not sure I fully agree with this BlackRock chart — there are times when cash makes sense. However, I cannot disagree with the takeaway that you cannot sit in cash for very long stretches of time (years) and expect any sort of return above inflation.
Click to enlarge |
| Posted: 19 Jun 2013 07:00 AM PDT My morning reads:
What are you reading?
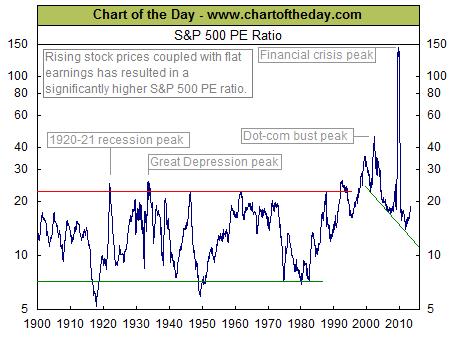
Price to Earnings Ratio (PE Ratio) from 1900 to Present |
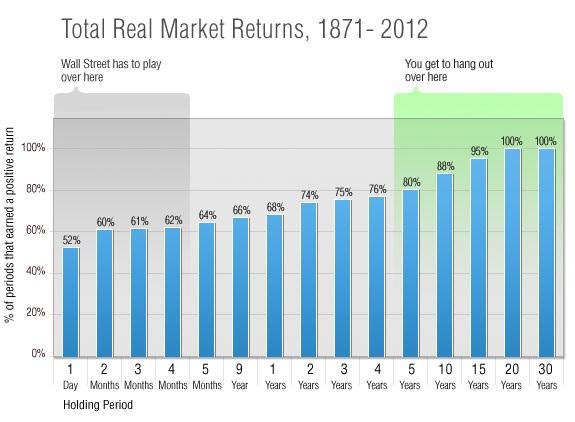
| Time, Time, Time Is On Your Side (Yes it is) Posted: 19 Jun 2013 04:15 AM PDT
Morgan Housel has a very insightful column this morning, driven by one of my favorite topics: Taking yourself out of the minute-to-minute, day-to-day time frame and rethinking your investing parameters in terms of years and decades. That longer time frame is an enormous luxury, a monstrous advantage amateurs at home have over the pros. Here’s Housel:
Or to be even more succinct, Henry Blodget observes that professional managers are “thinking about the next week, possibly the next month or quarter. There isn’t a time horizon; it’s how are you doing now, relative to your competitors. You really only have ninety days to be right, and if you’re wrong within ninety days, your clients begin to fire you.” That is the beauty of the chart above showing (inflation-adjusted) S&P500 returns going back to 1871 relative to various holding periods. Short term is more or less random; longer term, the odds move in your favor. And very long term approaches 100% positive returns, even after inflation.
Go read the full piece + see the rest of the charts. Its great stuff . . . Source:
The Rolling Stones – Time Is On My Side |
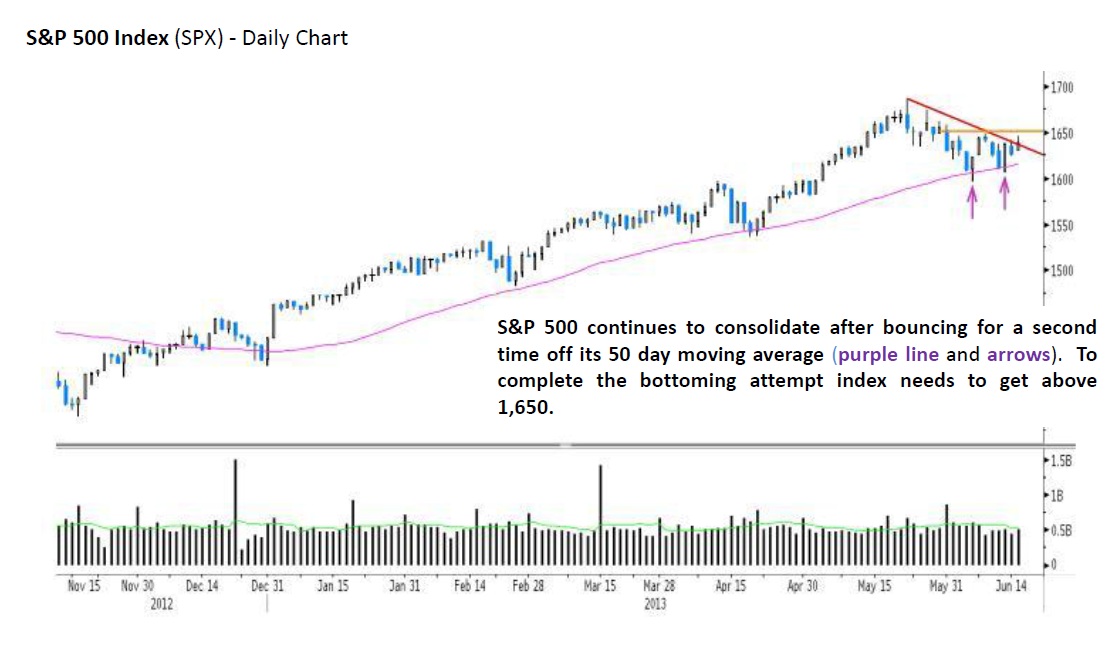
| Equity Market Review for June 18th 2013 Posted: 19 Jun 2013 03:00 AM PDT Click to enlarge Major U.S. indices such as the S&P 500 and the NASDAQ Composite have both recently stabilized and bounced for the second time off their respective 50 day moving averages. Though historically June tends to be a negative month for stocks, with only 9 trading days left in the quarter we wonder aloud whether quarter ending "window dressing" will keep stocks elevated until June passes. Market internals have certainly shown some deterioration of late, however, the old adage is to respect the trend and the trend still remains up as long as the recent lows, near the respective 50 day moving averages, hold. Please see attached note for chart on the S&P 500 and NASDAQ Composite.
|
| You are subscribed to email updates from The Big Picture To stop receiving these emails, you may unsubscribe now. | Email delivery powered by Google |
| Google Inc., 20 West Kinzie, Chicago IL USA 60610 | |


0 comments:
Post a Comment