


The Big Picture |
- Relationship and Transaction Lending in a Crisis
- China Invented Every Form of Money
- USA’s ‘AAA’ Placed on Rating Watch Negative at Fitch
- 10 Tuesday PM Reads
- Are Market Crashes Inevitable?
- 90% Up Days Are Bullish
- 10 Tuesday AM Reads
- The Problem With Financial Media
- This Secular Bear Has Only Just Begun
| Relationship and Transaction Lending in a Crisis Posted: 16 Oct 2013 02:00 AM PDT | |
| China Invented Every Form of Money Posted: 15 Oct 2013 10:30 PM PDT 9 Mind-Blowing Facts About MoneyChina:
Debt Forgiveness Is The Basis for Modern CivilizationReligions were founded on the concept of debt forgiveness. For example, Matthew 6:12 says:
Periodic times of debt forgiveness – or debt "jubilees" – were a basic part of the early Jewish and Christian religions, as well as Babylonian culture. David Graeber, author of "Debt: The First 5,000 Years" told Democracy Now:
Ambrose Evans-Pritchard wrote in 2009:
Indeed, the first recorded word for "freedom" in any human language is the word for freedom from debt. (Moreover, there is a long-standing legal principle that people should not have to repay their government's debt to the extent that it is incurred to launch aggressive wars or to oppress the people … what is called "odious debt"). The Real Reason Money Was Created?Everyone was taught that money was invented to replace the messy business of barter. It's hard work walking my cow all the way to your village to trade for firewood … and then carrying all of that firewood back home. And what if no one wants my cow? But economist Charles Goodhart – a former member of the Bank of England's Monetary Policy Committee – anthropologist David Graeber, and other experts on the history of money say that this is a myth. (Bloomberg has written on this issue.) Instead, they say that money was invented to finance war, and to keep score while armies went about pillaging and looting. Lifespan of CurrenciesThe average life expectancy for a fiat currency is less than 40 years. But what about "reserve currencies", like the U.S. dollar? JP Morgan noted last year that "reserve currencies" have a limited shelf-life: As the table shows, U.S. reserve status has already lasted as long as Portugal and the Netherland's reigns. Will the dollar last as long as Spain, France or Britain's reserve currencies? It's impossible to know. But given that the dollar's reserve status has been slipping away for many years – and that the European Union (the world's largest economy) has now entered into a currency swap agreement with China – the dollar's reign may only have a couple of years left. Big Banks Are Not Really In the Banking BusinessEveryone thinks of banks as holding our deposits safe, and extending loans based upon the amount of deposits they hold in their vaults. This is no longer true. The big banks currently do very little traditional banking. Most of their business is from financial speculation (which, sadly, metastasizes into manipulation and criminal behavior). For example, less than 10% of Bank of America's assets come from traditional banking deposits. Time Magazine gave some historical perspective in 1993:
Indeed, even though the taxpayers have thrown trillions of dollars at the "too big to fail" banks, they largely stopped loaning to Main street … and it was only the smaller banks that kept making loans. Inequality Today In America Is Worse than In Ancient Slave-Owning SocietiesInequality is much worse than you think … Indeed, inequality in America today is twice as bad as in ancient Rome, worse than it was in Tsarist Russia, Gilded Age America, modern Egypt, Tunisia or Yemen, many banana republics in Latin America, and worse than experienced by slaves in 1774 colonial America. Quantitative Easing Hurts the Economy81.5% of all money created through quantitative easing is sitting there gathering dust … instead of helping the economy. Indeed, quantitative easing actually hurts the economy, Main Street, and the average American. Yes, The U.S. Has DefaultedIt is widely stated that the U.S. government has never defaulted. In reality, the U.S. has partially or fully defaulted on numerous occasions. How Money Is Really CreatedBanks create money out of thin air, without regard to whether or not they have deposits on hand. This sounds like an outrageous statement … but the Federal Reserve has said as much. For example, a 1960s Chicago Federal Reserve Bank booklet entitled "Modern Money Mechanics" said:
Economist Steve Keen notes:
Moreover: (1) William C. Dudley, President and Chief Executive Officer of the Federal Reserve Bank of New York, said in a speech in July 2009:
(2) On February 10, 2010, Ben Bernanke proposed the elimination of all reserve requirements:
Under the current fractional reserve banking system, banks can loan out many times reserves. But even that system is being turned into a virtually infinite printing press for banks. Germany's central bank – the Deutsche Bundesbank (German for German Federal Bank) – has also admitted in writing that banks create credit out of thin air. Steve Keen points out that 2 Nobel-prize winning economists have shown that the assumption that reserves are created from excess deposits is not true:
In other words, if the conventional view that excess reserves (stemming either from customer deposits or government infusions of money) lead to increased lending were correct, then Kydland and Prescott would have found that credit is extended by the banks (i.e. loaned out to customers) after the banks received infusions of money from the government. Instead, they found that the extension of credit preceded the receipt of government monies. Indeed, Keen says that 25 years of research proves that creation of debt by banks precedes creation of government money, and that debt money is created first and precedes creation of credit money. This angle of the banking system has actually been discussed for many years by leading experts: "The process by which banks create money is so simple that the mind is repelled." "[W]hen a bank makes a loan, it simply adds to the borrower's deposit account in the bank by the amount of the loan. The money is not taken from anyone else's deposit; it was not previously paid in to the bank by anyone. It's new money, created by the bank for the use of the borrower." "Do private banks issue money today? Yes. Although banks no longer have the right to issue bank notes, they can create money in the form of bank deposits when they lend money to businesses, or buy securities. . . . The important thing to remember is that when banks lend money they don't necessarily take it from anyone else to lend. Thus they 'create' it." "The modern banking system manufactures money out of nothing. The process is perhaps the most astounding piece of sleight of hand that was ever invented." "Banks create money. That is what they are for. . . . The manufacturing process to make money consists of making an entry in a book. That is all. . . . Each and every time a Bank makes a loan . . . new Bank credit is created — brand new money." Additionally, in First National Bank v. Daly (often referred to as the "Credit River" case) the court found that the bank created money "out of thin air":
The court also held:
(Here's the case file). Justice courts are just local courts, and not as powerful or prestigious as state supreme courts, for example. And it was not a judge, but a justice of the peace who made the decision. But what is important is that the president of the First National Bank of Montgomery apparently admitted that his bank created money by simply making an entry in its book …. Moreover, although it is counter-intuitive, virtually all money is actually created as debt. For example, in a hearing held on September 30, 1941 in the House Committee on Banking and Currency, then-Chairman of the Federal Reserve (Mariner S. Eccles) said:
Robert H. Hemphill, Credit Manager of the Federal Reserve Bank of Atlanta, said:
(Former Fed chairman Alan Greenspan was so worried that the U.S. would pay off it's debt – causing the fed to "lose control of monetary policy" – that he suggested tax cuts for the wealthy for the purpose of increasing the debt.) There is a growing movement to give the power to create money and credit back to the government, so that the people can save many billions of dollars in interest payments to the big banks. But the giant banks are close to negotiating a secret trade treaty which would allow them to keep their monopoly on money creation. | |
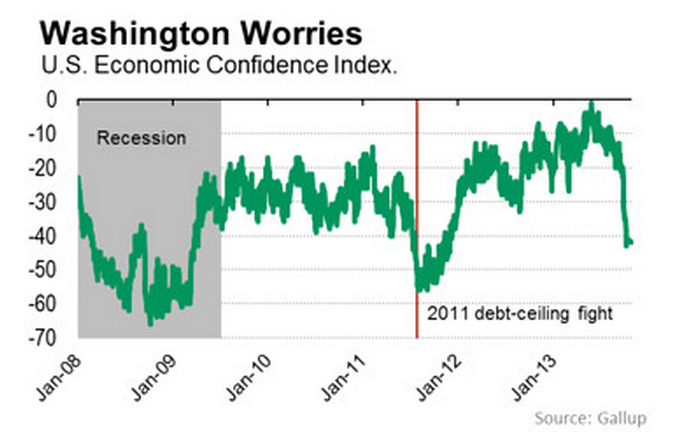
| USA’s ‘AAA’ Placed on Rating Watch Negative at Fitch Posted: 15 Oct 2013 02:02 PM PDT This is why you don’t fuck around with the debt ceiling:
Self inflicted wounds, courtesy of Tea Party wankers. | |
| Posted: 15 Oct 2013 01:30 PM PDT My afternoon train reading:
What are you reading?
Vital Signs: Shutdown Battle Taking Toll on Sentiment | |
| Are Market Crashes Inevitable? Posted: 15 Oct 2013 12:00 PM PDT Is another market crash coming? Yes. When is it coming? That's another question, and the real trick is figuring out how to be prepared for one while still working toward your investing goals. MarketWatch's Mark Hulbert drops in on the MoneyBeat show to discuss. Crash-Course Investing | |
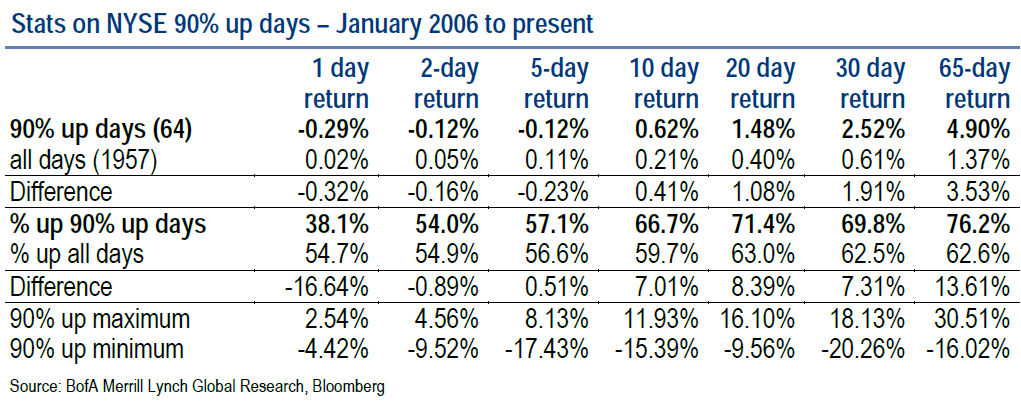
| Posted: 15 Oct 2013 09:00 AM PDT A 90% up day is bullish & the stats support a year-end rally
On Thursday. we had a huge up day, with US markets gaining ~2%. Some folks credited the possibility of a debt ceiling deal, while others called it a low volume short covering rally. Regardless, it was substantial, and should not be ignored. As the table above showed, these 90/90% up days– when 90% of stocks on the NYSE are up and 90% of the shares traded are to the upside — the tendency is towards higher future returns in the ensuing weeks and months. As you can see in the table above, 20, 30 and even 65 days after a 90/90 day, markets are higher at least 70% of the time. Under normal circumstances, that range would be low 60% range. In other words, the odds of gains improves some 10% over normal following a 90/90 day in our time period (20, 30 or 65 days from 2007-present) . Here’s Merrill’s Stephen Suttmeier:
That 14% edge over 65 days isn’t a sure thing, but it is quite statistically significant . . . Source: | |
| Posted: 15 Oct 2013 07:00 AM PDT My morning reading:
What are you reading?
Japanese Stocks Lure More Long-Term Investors | |
| The Problem With Financial Media Posted: 15 Oct 2013 04:30 AM PDT I am working on this week’s WaPo column, based loosely on last week’s open thread on the value of the Financial Media. I have a 23 bullet points I am trying to cut down to a dozen or less. Here are two:
This is the early draft; the Washington Post version will be far less coarse; their editorial policy is no F-Bombs . . .
| |
| This Secular Bear Has Only Just Begun Posted: 15 Oct 2013 03:30 AM PDT This Secular Bear Has Only Just Begun
Secular bull markets are great parties. Investors arrive from secular bears really wanting to take the edge off. As the bull proceeds, above-average returns become intoxicating. By the time it is over, the past decade or two has delivered bountiful returns. In contrast, secular bears seem like hangovers. They are awakenings that strip away the intoxication, leaving a sobering need for an understanding of what has happened. Conventional wisdom explains these periods as irrational or coincidental periods. In reality, secular bulls and bears are periods driven by longer-term trends in the inflation rate. A trend away from low inflation, whether to high inflation or deflation, drives the value of the market lower. That leaves investors with below-average returns. The return trip — when the inflation rate trends toward low inflation — drives the value of the market higher. That provides investors with above-average returns. Then there was the “party” in the late 1990s! Intoxication!! Can you imagine a party so extreme that you end the next day feeling just as groggy as when you first woke up? A long, long day of frustration and misery? That day was the past decade. In stock market terms, it has been twelve years of pain that just now brings investors to the starting line. Wake-up…this must be a nightmare. Oh no, it’s not!!! This is a moment of consternation — an eerie tension between hope and fear. You find yourself saying, “It’s not fair… It doesn’t seem right… Secular bear markets average eleven years, don’t they? Isn’t this one supposed to be over by now? Some pundits are saying there might be just a few more years left in this nasty old bear… What do you mean this secular bear has only just begun?” We’ll get to that in a moment; but for now, please step back from the edge. Even if a big bull is not around the corner, there’s plenty of opportunity. In fact, it is conditions like these that provide the greatest potential for astute investors. First, they must understand the environment. Then, investors can use that knowledge to their advantage. This discussion is about the first part — understanding. The upcoming charts will explain why we are actually early in the current secular bear and how we got here. There are many other resources for the second part — what to do about it. SECULAR CYLES IN PERSPECTIVE Let’s start with a look at secular bull markets over the past century. Figure 1 presents all four secular bulls since 1900. Each line represents the price/earnings ratio (P/E) annually over the life of the four secular bulls. The level of P/E is displayed on the vertical axis. Time, in years, is displayed on the horizontal axis. To reduce the distortions to P/E caused by the earnings cycle, earnings (E) have been normalized using the approach popularized by Robert Shiller at Yale. The index for the numerator (P) is the year-end value for the S&P 500. Therefore, the P/E displayed on the chart is the year-end Shiller P/E (i.e., Year-end P/E10). Figure 1. Secular Bull Markets  First, note that secular bulls start when P/E is low and end when P/E is high. The low points for all secular bulls have been quite similar. In the chart, the low range is designated with green shading. The high point for all secular bulls had also been fairly similar, until the late 1990s. It is as though the 1980s/1990s secular bull ran its course through the mid-1990s, then the party started and P/E more than doubled again. The already high P/E ascended to the stratosphere. Pundits often compare the late 1990s to 1929. Yes, the valuation of the market (as measured by P/E) was fairly high in 1929. But 1999 is in a league of its own. As the new millennium opened, the bubble stopped expanding — but it did not pop. An immediate decline of fifty percent would have been required to correct the excesses and to reach a typical secular bear start. Instead, the stock market see-sawed for about a decade. With each decline, it bounced back. As the underlying economy and baseline earnings level grew, the market slowly whittled its P/E back to levels associated with typical secular bull ends and secular bear starts. So it has taken more than a decade to wear away the effects of the late 1990s extremes. BEAR! Who says that markets are not considerate? A sudden decline in 2000 would have been a cruel polar bear plunge. Instead, the market tip-toed lower, allowing time for investors to adjust. Some investors have known for over a decade that we are in a secular bear market. Many of them, however, may not have realized just how elevated P/E was when this secular bear began. Figure 2. Secular Bear Markets  Figure 2 shows just how far we had to go. P/E is on the left axis; time is across the lower axis. The chart presents all of the secular bear markets from the past century. The format is similar to that in Figure 1. Pause for a moment to reflect upon Figure 2. Contrast it back and forth with Figure 1. Every secular bear cycle prior to our current one followed a secular bull that ended with P/E in or near the red zone. That set the starting point for every adjacent secular bear. But this time, the super secular bull of the late 1990s ended nearly twice as high — it was a major bubble. Therefore, it is realistic to expect that our current secular bear might last a lot longer or be twice as gnarly as past secular bears. Because the Fed and other factors have kept the economy in a state of relatively low inflation, the current secular bear has ground its way back to the reality of the red zone. What goes up, must come down. Figure 2 is noteworthy for highlighting the lofty start of the current secular bear. Now after almost fourteen years, the market P/E is down, but only into the red zone. That level, however, is not overvalued. It was overvalued in 2000 and at many points over the past decade. There were not plausible economic and financial conditions to justify P/E near 30, 40, and more. Now, finally, the stock market is fairly-valued for conditions of low inflation and low interest rates (assuming average long-term economic growth in the future). But what about the future? If inflation remains low and stable indefinitely, then this secular bear will remain in hibernation until the inflation rate runs away in either direction. A period of hibernation, however, does not cage the bear and allow a bull to roam. Rather, it means that investors will receive returns consistent with relatively high starting valuations — nominal total returns for the stock market of around 5%-6%. Hibernation avoids the declining P/E of a secular bear. It is the decline in P/E that causes secular bears to deliver near zero return. Hibernation also means that there is almost no chance of better returns. Average and above-average returns require a significant increase in P/E. From the red zone, higher P/E requires an irrational bubble. That is never a prudent assumption for a financial plan. HOW & WHY The economy experiences periods of rising inflation, disinflation (i.e., declining inflation), deflation (i.e., negative inflation), reflation (i.e., increasing inflation inside of deflation), and price stability (i.e., low, stable inflation). The periods run in a natural sequence around the starting point of price stability. To illustrate, the cycle starts with low inflation. Then, due to excess money supply growth or other factors, the inflation rate rises. At some point, economic policies or factors reverse the trend, thereby starting a period of disinflation (i.e., declining inflation). Once back at price stability, the trend can either hold in a state of low inflation or it can move upward or downward across another cycle. The P/E for the stock market is driven by the trend in and level of the inflation rate. As a result, there is a cycle for P/E based upon the inflation-rate cycle. High inflation and deflation drive P/E lower. Price stability drives P/E higher. The P/E cycle creates secular bull and secular bear markets. Some secular periods have been long, yet others have been relatively short. Time does not drive secular periods. Rather, the inflation-rate cycle determines whether they will be relatively quick or quite extended. Inflation-rate trends can last a few years or they can extend for decades. Secular bull markets transition into secular bears, which are followed by secular bulls. Neither secular bulls nor secular bears are isolated periods. Instead, they necessarily precede and follow each other. This is why they are designated as cycles rather than simply as periods. They are called secular because they have a common characteristic and driver that extends over an era. The term secular is derived from a Latin word that means an era, age, or extended period. Actually, an original Latin variation of the word has been closer to hand than most people realize. On the back of the American one-dollar bill is the Great Seal of the United States. One part of the seal is the circle on the left-hand side bearing a pyramid topped with an eye. Look closely under the pyramid: there is a banner with the phrase “novus ordo seclorum.” In 1782, Charles Thomson, a Founding Father of the United States, and secretary of the Continental Congress, worked as the principal designer of the Great Seal. There is extensive symbolism included in the seal. When Thomson proposed the seal to Congress, he described the meaning of novus ordo seclorum as “the beginning of the new American Era.” When the word secular is used to describe stock market cycles, it expresses that the cycle is an extended period with something in common throughout. Secular bull markets are extended periods that cumulatively deliver above-average returns. These periods are driven by generally rising multiples of valuation as measured by the price/earnings ratio (P/E). Secular bear markets are the opposite: extended periods with cumulative below-average returns driven by a generally declining P/E for the market. Thus the secular aspect of these periods relates to the generally rising or falling trend in P/E over an extended period of time. THE FUTURE: DECADES If history is a guide, the inflation rate will at some point trend away from the present price stability. The result will be a significant declining trend in P/E. If this occurs over a few years, the market losses will be dramatic. More likely, it will take a decade or longer. That will enable the underlying economy and baseline earnings to grow, thereby offsetting the decline in P/E. As we have seen from history, that means another decade or longer of near-zero returns.
These processes take many years. Be careful not to let hope for the next secular bull mask the reality of the current secular bear. Many more years of vigilant investing will be required for portfolio success. As Robert Frost so aptly wrote:
Ed Easterling is the author of Probable Outcomes: Secular Stock Market Insights and award-winning Unexpected Returns: Understanding Secular Stock Market Cycles. He is President of an investment management and research firm, and a Senior Fellow with the Alternative Investment Center at SMU’s Cox School of Business, where he previously served on the adjunct faculty and taught the course on alternative investments and hedge funds for MBA students. Mr. Easterling publishes provocative research and graphical analyses on the financial markets at www.CrestmontResearch.com. |

 When the adverse inflation-rate trend reaches its nadir, we will mark the end of this secular bear and the start of the next secular bull. As the economy or the Fed reverses the adverse inflation-rate trend back toward price stability, P/E will trough at its lows and begin the long climb that drives secular bull markets.
| You are subscribed to email updates from The Big Picture To stop receiving these emails, you may unsubscribe now. | Email delivery powered by Google |
| Google Inc., 20 West Kinzie, Chicago IL USA 60610 | |


0 comments:
Post a Comment