


The Big Picture |
- Deal Done!
- A Conversation with Elon Musk
- 10 Wednesday PM Reads
- Who Goes to Work? Who Stays Home?
- Debt Ceiling Debacle Has Already Damaged the U.S.
- 10 Wednesday AM Reads
- The Bull and Bear Case
- Forward Markets: Macro Strategy Review
| Posted: 16 Oct 2013 07:38 PM PDT Deal Done!
Deal done! Lesson 1. There will be no default. Disgraceful, divisive Democrats and ridiculed, repugnant Republicans, who share blame equally for this horrendous example of poor governance, are aware that the country must not default. They agree on that. So, no default! Lesson 2. Government must operate. Defense, healthcare as in CDC flu shots and the control of tuberculosis and salmonella outbreaks are essential services, too. So are the disbursal of disabled veterans’ benefits and the provision of public education and a million other things. Enough of this crap. The country has had it with failed governance. If our memories don't get hijacked by the issues and diversions that intervene, we are going to be angry next year at the polls and throw out a few Democrats and a few Republicans and replace them. Will we remember? When people think back, will they recall this fall’s political debacle – or the baseball playoffs? We shall see. Lesson 3. Listening to the political rhetoric from the Senate is enough to make me puke. They made this mess. They haven't passed a budget in five years. They set the stage for this debacle two years ago with the Budget Control Act. Now they are claiming credit for resolving a mess they created. Damn. Lesson 4. One Senator who filibustered for 21 hours succumbed to criticism. He also raised an enormous amount of money during his day of fame. He may have put his political party in the hole for next year's elections. Time will tell. Senator Ted Cruz, the Tea Party candidate for president, has done a huge disservice to the country and his political party, while serving his own interests. Think about it. The party that sought Obama's birth certificate now wants to amend the constitution so a Canadian-born citizen can be president. Do you smell an inconsistency there? Lesson 5. Markets are willing to look across the valley of the shadow of default and see that the fundamental fabric of our great America remains intact. We are still the best place to be on this planet – although sometimes we are the least worst. This is our system. We own it. We also own our complacency, because more folks will watch the baseball playoffs than will focus on shenanigans in Washington. Can we get angry and stay angry enough to throw many of these bums out? Time will tell. At Cumberland Advisors, we are fully invested and expect the S&P to cross 1800 before spring. We expect the Fed to put tapering on hold until they see recovery from this setback that Washington created. These are our assumptions. We also expect another round of reprehensible behavior from the miscreants in Congress in the coming months. So be it. That is our American way. Lastly, allow me to share my favorite fantasy with regard to the political madness we just endured. It was that the idiots on the Hill completely failed, and then Social Security payments didn’t go out. Then millions of grey panthers stormed congressional offices and got up from their wheel chairs and beat the living ____ out of their congressmen and -women with their canes, in the same way that they beat Congressman Rostenkowski in 1979. I fantasize a 75 year-old's breaking a cane over the head of a member of Congress while shouting, "You are supposed to work for me and you failed me and I have had enough!" Somehow that is an image that warms the cockles of my heart. We will not see that happen. But we can know that the fear of a backlash is something that motivates these characters we elect to our government. Dems and Repubs, thanks a lot for dragging our nation through this crisis. Shame on you. This time, our American societal and institutional fabric withstood the shock and now moves on. That is what we do. ~~~ David R. Kotok, Chairman and Chief Investment Officer |
| Posted: 16 Oct 2013 04:30 PM PDT |
| Posted: 16 Oct 2013 01:30 PM PDT My afternoon train reading:
What are you reading?
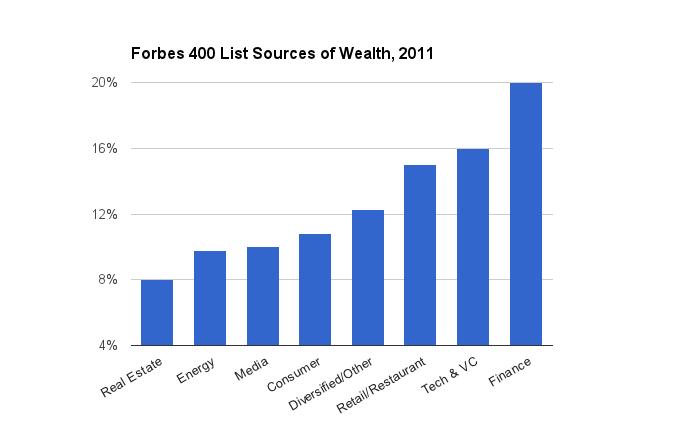
How the .0001% Made its Money |
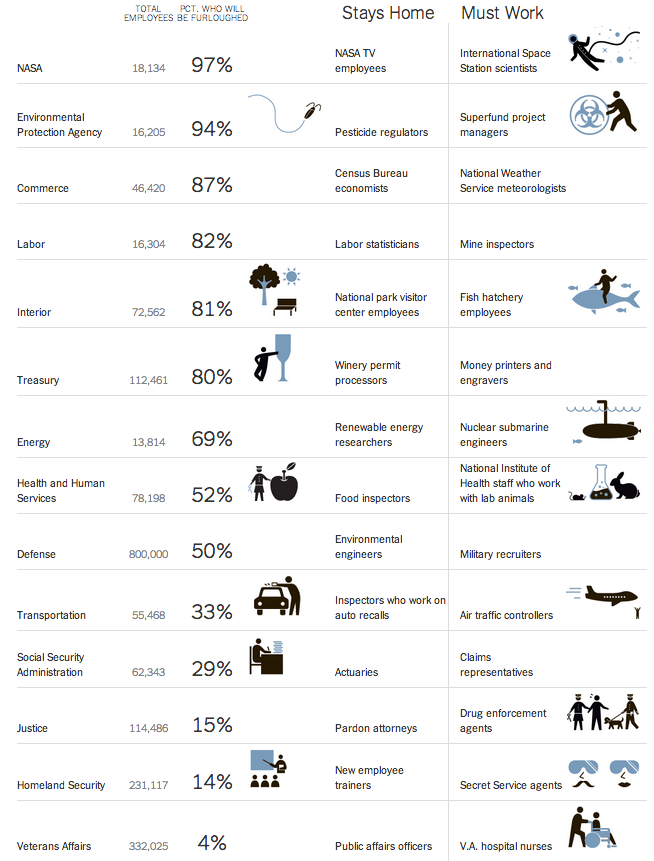
| Who Goes to Work? Who Stays Home? Posted: 16 Oct 2013 11:30 AM PDT Click for interactive graphic |
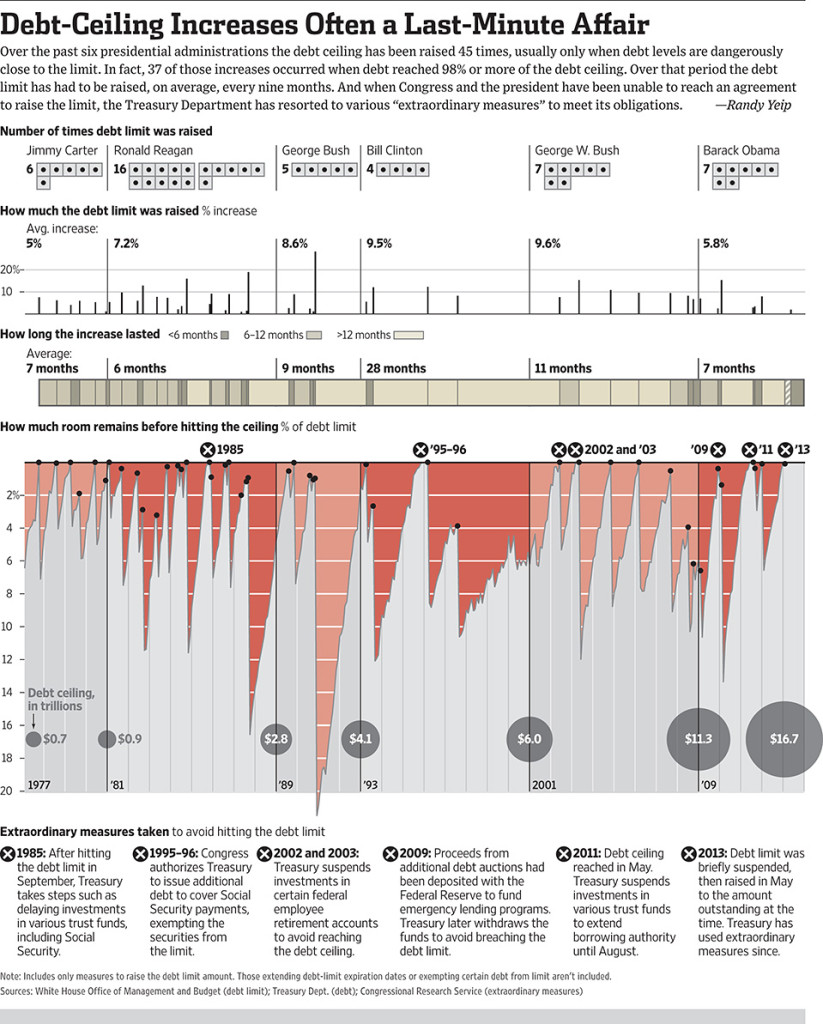
| Debt Ceiling Debacle Has Already Damaged the U.S. Posted: 16 Oct 2013 08:30 AM PDT Dysfunction Is Limiting U.S. Position Abroad, Observers Say; ‘Sadness From Our Trading Partners’ click for ginormous graphic
Here is the problem with using the debt ceiling as a negotiating tactic: It does permanent, long lasting damage to the reputation of the US, and hastens the day when the US Dollar is no longer the world’s reserve currency. The damage has ALREADY made US financing more expensive, impacted consumer confidence, and shaved a few bps off of GDP. The lasting ramifications of this are even greater, and future generations will spit expletives whenever they mention the 113th Congress. The Tea Party has made it clear: Ideology first, party second, country last. They should be treated as hostile adversaries in all future negotiations.
See also Contra:
Source: |
| Posted: 16 Oct 2013 06:52 AM PDT My morning reading:
What are you reading?
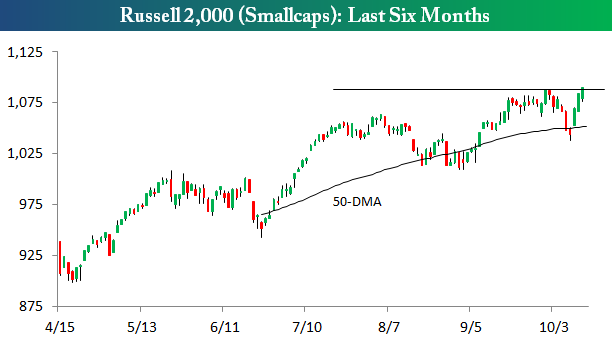
Smallcaps Hit New All-Time Highs |
| Posted: 16 Oct 2013 04:15 AM PDT In the format of our weekly Succinct Summations, here are the overall Bull and Bear Cases for the markets: For the Bulls:
For the Bears:
~~~ Peter Boockvar, Chief Market Analyst |
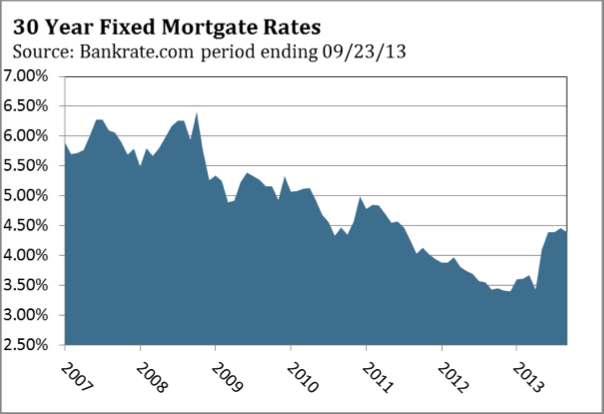
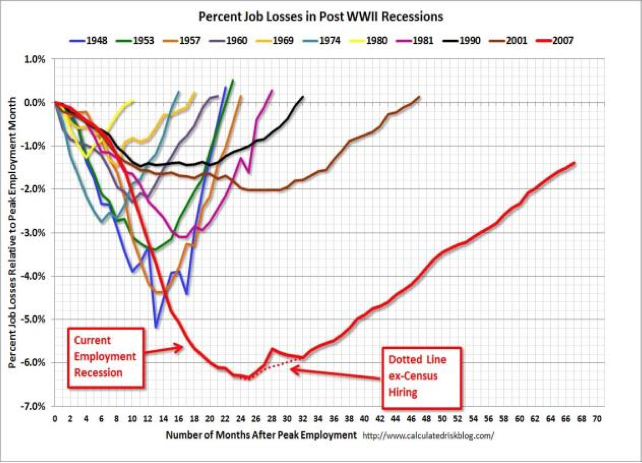
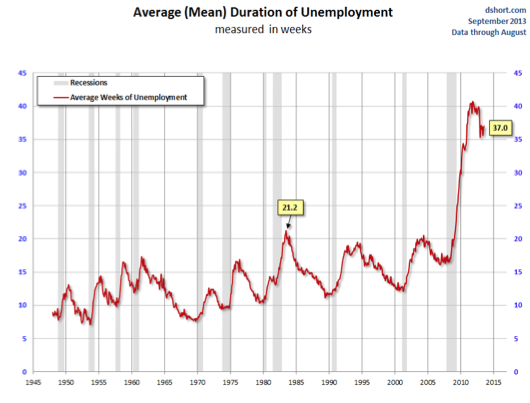
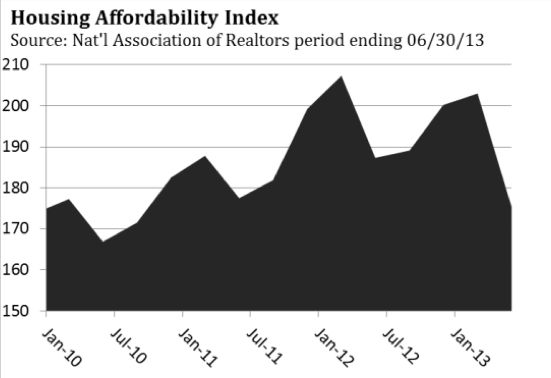
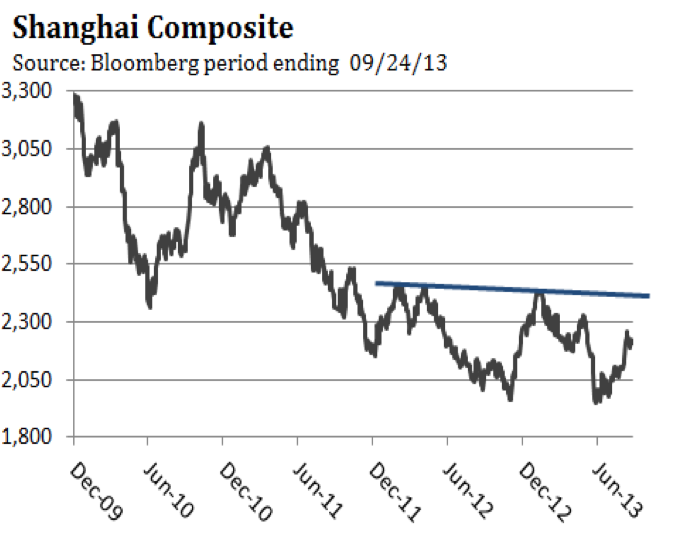
| Forward Markets: Macro Strategy Review Posted: 16 Oct 2013 03:00 AM PDT October 2013 Forward Markets: Macro Strategy Review Macro Factors and Their Impact on Monetary Policy, The Economy and Financial Markets Federal Reserve The Federal Reserve's decision not to reduce their $85 billion of monthly purchases of Treasury bonds and mortgage-backed securities surprised the majority of market participants. In our August commentary we discussed what the Fed might do at their September 17-18 Federal Open Market Committee (FOMC) meeting and noted the following: "Recent data has not clearly supported lowering the amount of quantitative easing (QE3) purchases, and the increase in mortgage rates has to be a concern for doves and hawks alike. Although we were incorrect in expecting the Fed to begin tapering in September, the post-FOMC meeting statement touched on each of the points we thought important. The following is an excerpt from the FOMC statement: "The tightening of financial conditions observed in recent months, if sustained, could slow the pace of improvement in the economy and labor market. Taking into account the extent of federal fiscal retrenchment, the Committee decided to await more evidence that progress will be sustained before adjusting the pace of its purchases." The Fed's decision not to taper suggests that its confidence that the economy will accelerate in coming quarters is not as high as it was in July. We expect strength in housing and auto sales to moderate in coming months and job and income growth show no signs of materially picking up. The Affordable Care Act, which has already had a negative impact on the labor market, might intensify after it is implemented on October 1. In its statement, the Fed reiterated the fact that it is data dependent, meaning it will delay further action until the data reveals economic growth. This could pose a problem if the economy does not begin to grow by 3% or better in coming quarters. U.S. Economy The majority of economists still expect gross domestic product (GDP) growth to accelerate before the end of 2013, and grow more than 3% in 2014. This constructive outlook was buttressed when GDP for the second quarter was revised up to 2.5% from the initial 1.7% estimate. After growing only 1.1% in the first quarter, the jump to 2.5% looks pretty good. The increase was fueled by an upward revision in exports from 5.4% to 8.6% — the most in almost three years. Businesses also restocked their inventories, which added 0.59%. In assessing the quarterly GDP report, it's important to understand how some of the components affect the announced GDP figure. Imports are subtracted from GDP since the goods being imported are produced outside the U.S. Although logical, subtracting imports from GDP understates the level of domestic demand. Inventories tend to bounce around from quarter to quarter, adding to one quarter and subtracting from the next. Seen in this light, inventories are noise. In our opinion, final sales may provide the clearest picture of how the economy is performing. In the revised GDP report for the second quarter, final sales were actually lowered from 2.0% to 1.9%. Over the last year, final domestic sales are up 1.5%, not much different than the 1.6% gain in GDP but with less volatility. Since early in the year, our view has been that GDP would continue to hold near 2%. In 2011, 2012 and the first half of 2013, GDP growth hovered near 2%, even though housing and vehicle sales improved measurably. The primary reason GDP growth hasn't been stronger is the tepid growth in earnings that most workers have experienced during the current recovery. According to Sentier Research, real median annual income as of June 30, 2013, has fallen 4.4% since the "recovery" began in June 2009. In terms of dollars, real median annual income fell from $54,479 in June 2009 to $52,098 by the end of June 2013. The median is the midpoint of all wage earners, so more than half of all workers' income has failed to keep up with the cost of living during the recovery. Sentier Research bases its estimates on the U.S. Census Bureau's and U.S. Bureau of Labor Statistics' monthly Current Population Survey using pre-tax income adjusted for inflation. Despite unprecedented monetary and fiscal stimulus, the current recovery has been the weakest recovery of the 11 recoveries since World War II. The current recovery has been especially brutal for workers under the age of 25. While the official unemployment rate dipped to 7.3% in August, for those under age 25 it was 15.6%, and it would be close to 20% if the people who have stopped looking or who have gone back to college were included. A little more than half of those under 25 are working full time compared to 80% of the working population at large. Economic research shows that the first few years after college play an important role in career development and future income. One recent study by Yale University showed that on average about two-thirds of wage growth comes in the first 10 years of a person's career. As such, many of today's young workers will earn less over their entire lives because of the weak economic recovery and a delayed start to their careers. The impact of youth unemployment and underemployment on our economy and tax receipts in coming decades is profound. Commissioned by the Corporation for National and Community Service, a federal agency that promotes service and volunteering, a 2012 analysis estimated that the 6.7 million American youth disconnected from school and work could ultimately cost the country $4.7 trillion in GDP growth. This estimate includes lost future earnings, a greater reliance on government programs resulting in more government spending and more criminal activity. The agency also estimated $1.6 trillion in lost tax revenue from unearned wages. The Congressional Budget Office says demographics are going to drive Social Security and Medicare spending significantly higher over the next few decades, beginning in earnest after 2023. Whether we acknowledge it or not, most Americans under 50 are going to have to pay more taxes so government spending promises can be kept to older Americans. This, unfortunately, will fall disproportionately on the youngest generation. The weak job market is affecting the life choices of many young adults. Over the last 40 years the percentage of those under the age of 24 living with their parents held steady at 51%, according to Pew Research. A recent study found the rate had jumped from 51% in 2007 to 56% in 2012. These young adults are moving out of their parents' homes later than previous generations, as well as getting married and having children later in life than their parents. The birth rate for women in their 20s has been dropping since the 1960s and reached an all-time low in 2012. Unless their financial circumstances improve significantly, today's 20-somethings will likely have fewer children than their parents as well. This generation, like no other generation before it, is entering the work force after college "behind an eight ball" of student debt. Believing a college education was a necessity, and with less help from the "bank of mom and dad," they chose to borrow what they needed to get their college degree. Based on 2011 data, the Census Bureau estimates workers who have an associate degree earn a median annual income of $36,853, while those with a bachelor's degree earn an average $48,648. Workers with a high school diploma earn a median average of $28,659. Historically, a college degree has meant a lot in establishing a rewarding career and lifetime earnings. Unfortunately, recent college graduates are encountering a job market environment like no other since the Depression. A brief history of education lending is interesting and provides another example of "good intentions and unintended consequences." The first reference to the "Great Society" was made by President Lyndon B. Johnson on May 7, 1964, in a speech at Ohio University. The legislative push to create the Great Society included the Food Stamp Act of 1964, Civil Rights Act of 1964, Economic Opportunity Act of 1964, Voting Rights Act of 1965, the establishment of Medicare and Medicaid in 1965, and the Higher Education Act of 1965. The Higher Education Act began a transition from federally funded institutional assistance to individual student aid, which was provided through federal scholarships and low interest loans aimed at making college more accessible to lower income students. In 1964, the year before the Higher Education Act was passed, student aid by the federal government totaled $231 million. By 1981, student loans had increased to $7 billion per year, and by 2012 had mushroomed to $105 billion. When the Affordable Care Act was passed in 2010, House Minority Leader Nancy Pelosi said they would have to pass the bill in order to find out what was in it. One of the provisions of the Affordable Care Act was the elimination of government guarantees for student loans extended by private lenders such as Sallie Mae. Instead, the federal government would extend the loans directly to students. Surprisingly, for most student loans the federal government does not check credit records of the students or parents applying for the loans. According to the Consumer Financial Protection Bureau, as of June 30, 2013, the total amount of student loans was $994 billion, up from $300 billion in 2004. Since this debt is backed by the federal government, taxpayers are on the hook. Student loan debt is larger than the $814 billion in auto loans and $668 billion in credit card debt. Since 2008, student loans are the only category of consumer debt that has increased. As we mentioned previously, the primary goal of the Higher Education Act of 1965 was to make a college education accessible to lower income students. In 1970, 12% of college graduates came from the bottom income quartile. According to the National Center for Education Statistics, in 2012 the bottom quartile of graduates was just 7%. Those who conceived of aiding lower income students back in 1965 would likely be disheartened and dismayed that fewer students are being helped now than in 1970. The Higher Education Act of 1965 has failed to achieve its primary goal, despite the funding of hundreds of billions of dollars in student loans. Until the 2008 financial crisis, the degradation of lending standards made it possible for many unqualified people to buy a home. Easy credit stoked demand, resulting in higher home prices and the subsequent housing bubble. A similar situation is happening with student loans. The availability of student loans has made it possible for more high school graduates to enroll in college. In 1967, 4.3 million people were enrolled as undergraduates, which represented 2.2% of the U.S. population. By 2010, enrollment had increased by 70% to 11.5 million, or 3.7% of the population. According to the National Center for Education Statistics, 21.9% of Americans aged 25-29 had at least a bachelor's degree in 1975. By 2012 that percentage had increased to 33.5%. The additional demand fueled by credit has clearly been a contributing factor in rising tuition costs, especially over the last 10 years as student debt has soared. According to the U.S. Department of Education, the average annual tuition at a public college or university in 1965 was $6,592. By 2011, the tab had increased to $13,297, an increase of 101.7%. The annual cost for tuition at private schools soared 137.2%, rising from $13,233 in 1965 to $37,395 in 2011. These figures were adjusted for inflation and include tuition, fees, and room and board. Of the first-time college freshmen who enrolled in 2006, just 55% had graduated in 2012, according to the National Student Clearinghouse. This indicates there are a sizeable number of former college students with some level of student debt, but no degree to hang on the wall. According to the Consumer Financial Protection Bureau, there are 27.8 million students with loans. Of this total, 7.9 million, or 28.4%, are still in school or within the six-month repayment grace period. Of the 19.9 million students no longer in school, 10.8 million, or 54.3%, are currently repaying their student loans. The remaining 9.1 million (45.7%) of those out of school have either defaulted on their loans or are behind on their payments. If these trends hold, up to $400 billion of the $1 trillion in government-backed student loans will not be repaid by former students, but by taxpayers. At 45.7%, the default rate on student loans may turn out to be almost twice as high as the default rate on subprime mortgages. As we mentioned previously, the Higher Education Act of 1965 started with the worthy goal of making a college education possible for young adults in the bottom income quartile. Along the way, millions of young adults earned a college degree, started a career and a family, bought a house, contributed their talents to our economy and paid taxes. However, over the last decade, the cost of a college education has soared and the amount of student loans has tripled to $1 trillion, or roughly 16% of GDP. Millions of former students will have their credit destroyed if they fail to pay, and millions more will struggle to pay off their loans. The rebound in housing since the end of 2010 has been one of our economy's pillars of growth. New single family home sales have increased 20.8%, rising to 394,000 from 326,000. Since the end of 2010, existing home sales have risen 28.3% from 4.27 million to 5.48 million as of August 2013. Residential housing added 0.37% to second quarter GDP. A number of factors helped skew the balance between supply and demand in favor of demand. Low home prices and mortgage rates lifted affordability to a record high. Large investment firms spent billions of dollars buying homes, a demand source unique to this housing cycle. Smaller investors also purchased homes in some of the most depressed housing markets and then flipped them after fixing them up. Potential supply was kept off the market since 20-25% of exiting homeowners were still underwater, with a mortgage balance greater than their home's value. The sale of foreclosed homes has declined significantly since the end of 2010, removing supply that had previously depressed home prices. The recovery in home prices reversed the prevailing negative psychology about the housing market, which in turn boosted demand. As we discussed in detail in our July commentary, the rate of improvement in the housing market is likely to moderate. Affordability has slipped due to higher home prices and higher mortgage rates. Surveys of investment pools that purchase residential property show that they are planning on buying fewer homes in coming months. Positive psychology is likely to be dampened as the annual price gains, as measured by the S&P/Case-Shiller Home Price Index, rise at a slower rate in coming months. Since most home purchase transactions take up to 60 days to close, the full impact of the increase in the 30-year mortgage rate (from 3.6% at the end of April to 4.8% before the FOMC meeting), won't be known until home sales for September are reported in November. The Federal Reserve's decision to maintain its $85 billion in monthly purchases may help moderate some of the slowdown in housing activity, but not all of it. Most economists and the Federal Reserve have forecast a pickup in the economy by year-end as well as in 2014. China As we noted in our June commentary, credit growth in China grew an extraordinary 50% in the 12 months ending in May. Since economic activity lags change in monetary policy by about six months, we expected the surge in credit to stabilize China's GDP growth between 7-8% through the third quarter. Recent reports confirm that the expected stabilization is taking place. The HSBC Flash China Manufacturing PMI Index for September rose from 50.1 in August to 52.1, with readings above 50 indicating growth. Total electricity consumption in August jumped to an annual increase of 13.7% from 8.8% in July. Industrial output in August showed a gain of 10.4% from a year earlier, and up from 9.7% in July. Taken together these reports indicate that China's economy is improving from its summer slump. From a short-term cyclical standpoint this improvement is constructive and suggests China will continue to grow in the 7-8% range. However, it would be a mistake to lose sight of the bigger picture in China. After a brief tap on the brakes in June by the People's Bank of China, policymakers have reverted to their old ways to make sure the government's annual GDP target of 7.5% is reached. Although its GDP target will be achieved, China is continuing to inflate its credit bubble, exacerbate its problem of excess capacity and allow local governments to spend on questionable infrastructure, such as airports, empty cities and highways. China's "total social financing," program leapt to $261 billion in August, double July's increase of $130 billion. The largest gains in August's industrial production came from industries already plagued with excess capacity like steel, iron, cement and coke. According to China Iron and Steel Association, in the first half of this year the average profit from selling a ton of steel was $.07. Infrastructure spending by local governments also picked up in August, with spending on highways up 23% from August 2012. It is important to note that China bases its GDP on production, not sales. GDP growth climbs whether or not the cities China is building are occupied or more industrial capacity is built and underutilized. China's export growth averaged 30% each year between 2003 and 2007 but exports were up only 9.2% through August of this year. This increases the risk that excess capacity could become a chronic problem, since China continues to add to its industrial capacity. Bank assets have soared 126.5% over the past four years, according to Fitch Ratings. Despite excessive credit growth, rampant excess capacity and low profit margins in the heavy industrial sectors that have powered China's infrastructure build out over the last five years, Chinese banks have a nonperforming loan ratio of less than 1%. For companies falling behind on their loan payments, Chinese banks are making new loans, which are used by the companies for payments on their prior loans. Banks are then able to classify the original loans as performing. Although the People's Bank of China can stretch out this banking charade, we believe a day of reckoning is coming in 2014 or 2015. In November, the Communist Party conclave will be held so nothing unpleasant will happen before then.
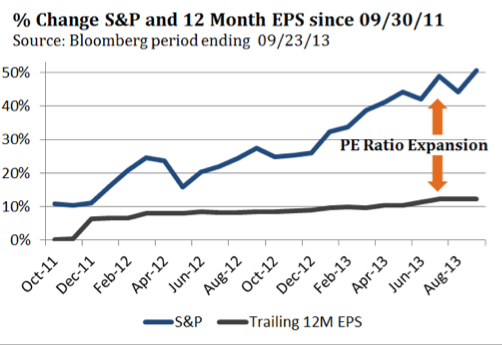
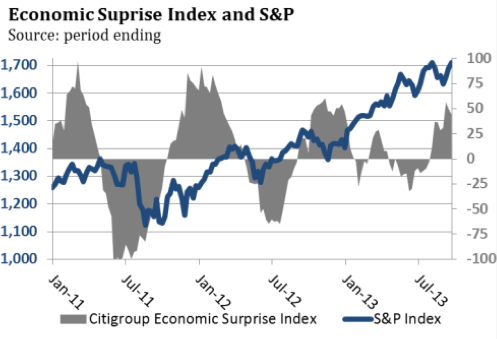
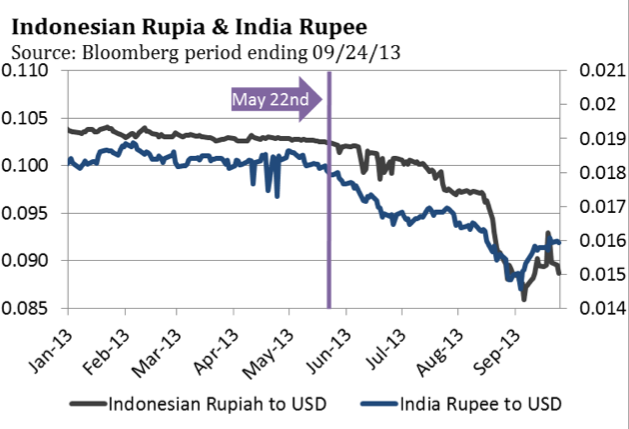
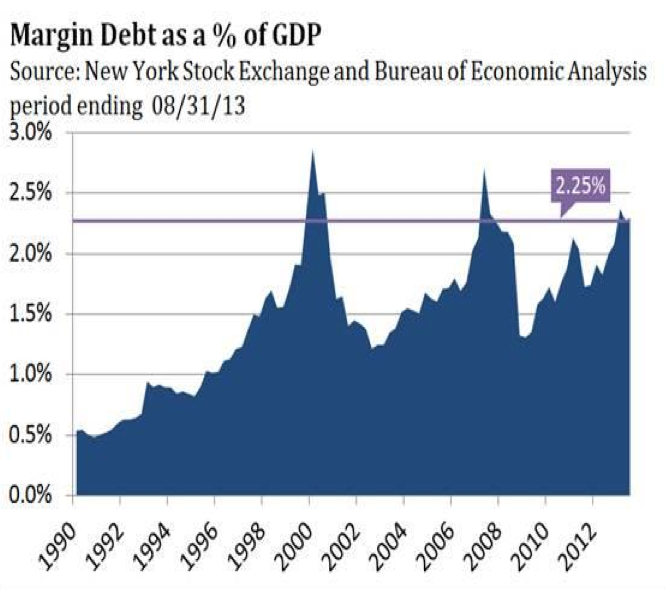
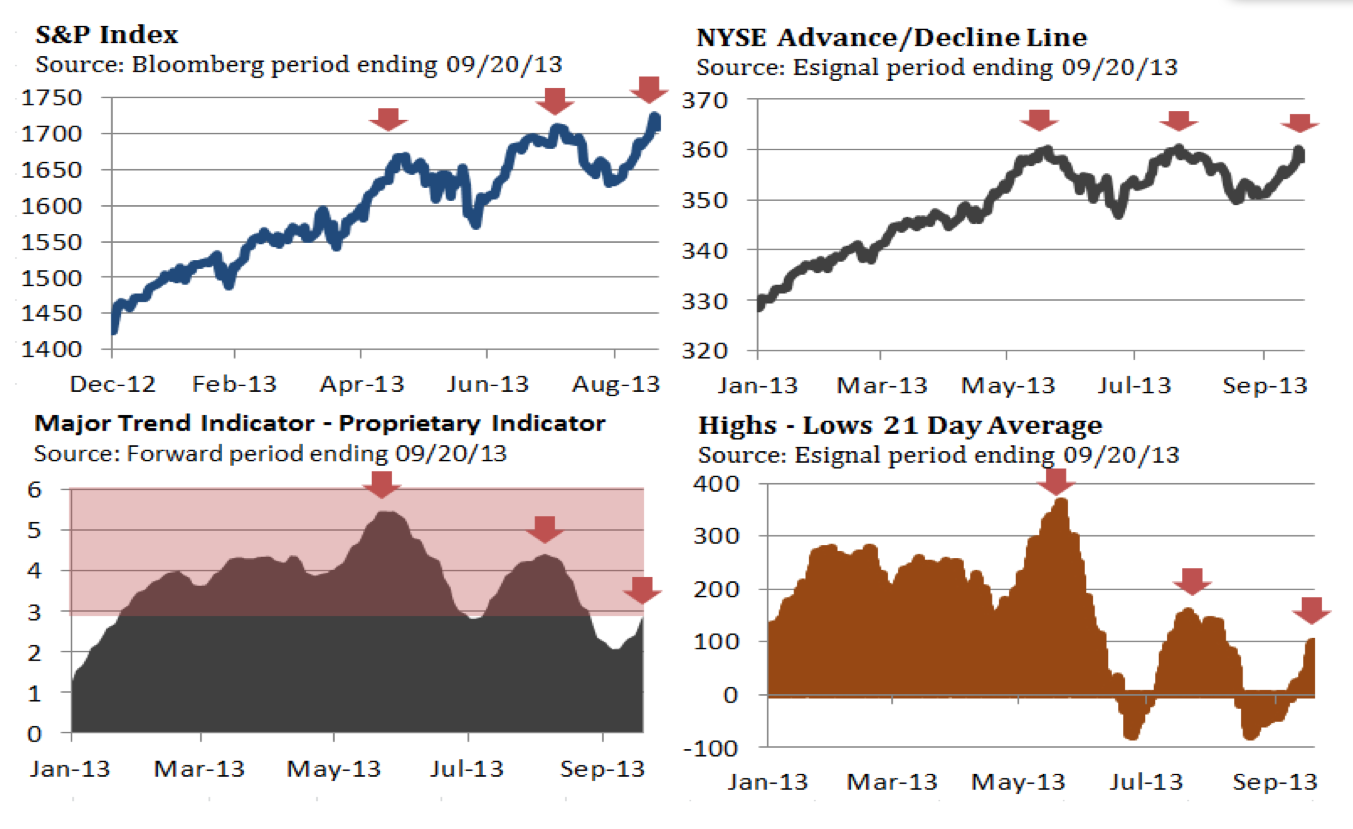
Emerging Countries The better economic news emanating from China has eased concerns and raised hopes that China's improvement will lift emerging economies like Brazil, India, Indonesia and Turkey out of their recent slump. While China's improvement and the Fed's decision not to taper can certainly help emerging economies in the short run, a number of countries are dealing with internal structural problems that won't easily be solved. Many emerging countries benefited from the Fed's QE3 program, which suppressed yields in the U.S. In search of a higher yield, international investors purchased the bonds of emerging countries. Stocks So far this year 140 Initial Public Offerings (IPOs) have raised $30 billion, which is more than the 128 IPOs in all of 2012. In addition, there are another 115 companies registered for an IPO before year-end, which would mark the highest number since 2007. A record number of IPOs are a reflection of speculation, and as such, serve as a warning sign for investors. The level of speculation can be inferred by how much an IPO gains on the first day of trading and its valuation. During the week of September 16, there were two IPOs that each soared by more than 80% on their first day of trading. At the close of the first day of trading, one of the firms, FireEye, a cybersecurity company, had a market capitalization of $4.2 billion. As of June 30, 2013, FireEye had $61.6 million of revenue during the first six months of the year, and posted a loss of $67.2 million. Sounds like a touch of speculation to us. The key to these sharp IPO price spikes includes a scarcity of shares being offered in the IPO coupled with a "buzz" carefully cultivated by the venture capital community. Margin debt as a percent of GDP has only exceeded 2.25% three times in history. The first time was in December 1999, and the stock market peaked on a closing basis in August 2000, eight months later. In 2007, margin debt surpassed 2.25% of GDP in July, just three months prior to the market high in October. In April of 2013, margin debt rose to a record $384 billion, surpassing the prior peak of $381 billion achieved in 2007, according to the Financial Industry Regulatory Authority. In doing so, margin debt as a percent of GDP rose to 2.37%. The true risk from a high level of margin debt is from a subsequent market decline that requires forced selling by over-margined investors, causing a steeper decline, as it did in 2001-2002 and 2008. As noted earlier, since September 30, 2011, the S&P 500 has soared 51%, even though earnings have increased only 12%. Although the market can enjoy additional gains from a further expansion in the price-to-earnings ratio, investors have been anticipating a pick up in the economy during the second half of the year that would boost revenues and earnings nicely. Given this expectation, investors might be disappointed and do a little selling if GDP and earnings don't accelerate. At the May and August highs in the S&P 500, the overall technical health of the market was good. This suggested a meaningful decline was unlikely and that any disappointing news was still months away. As we have noted every month, the S&P 500 continues to make higher highs and higher lows, which is the definition of an uptrend. In order to quantify whether the market is strengthening or weakening, we use a number of momentum indicators. The market is considered healthy if the technical indicators make a higher high or reach a high level when the S&P 500 makes a new high. As the S&P 500 reached a new all-time high in May and on August 2, it was joined by the majority of other market averages and the majority of momentum indicators. The Major Trend Indicator (MTI) is a proprietary indicator we use to measure the strength or weakness of market rallies and declines. Whenever a rally carries the MTI above +3.0 (shaded area in the Major Trend Indicator chart), it is a sign of market strength. At the May market high, the MTI reached +5.46 and was +4.41 when the S&P 500 peaked on August 2. As we discussed in our June and August commentaries, such high readings suggest that the market would mount another rally. However, for the first time since the low in November 2012, the market is beginning to show a marked loss of upside momentum. Even though the S&P 500 made a new high after the Fed's decision not to taper, the MTI has not moved above 3.0, although it is close. Even if it marginally does poke above 3.0, it will be far lower than the 4.41 reading in early August. The NYSE Advance/Decline Line (A/D Line) measures the net number of stocks that are rising or falling each day. As the S&P 500 was climbing into the May peak, the A/D Line kept pace by making successive higher highs. While the S&P 500 has continued to post new highs in August and September, the A/D Line has not, and it has notched what appears to be a triple top (as shown by the red arrows in the NYSE Advance/Decline Line chart). The good news is that the A/D Line hasn't been weaker, which would represent a more pronounced negative. The 21-day average of the net number of stocks that have made a new 52-week high or low has made successive lower highs (as shown by the red arrows in the 21-Day Average of Highs and Lows chart). The weakness in the A/D Line and net new high data suggests the market is vulnerable to the largest correction so far in 2013. A trend line connecting the December 31, 2012, low and June 24, 2013, low comes in near 1,645, which is not much above the August 28 low of 1,627. Should this area of support give way, the S&P 500 could quickly fall to 1,550 – 1,575. In our quarterly Macro Market Update webcast on July 10, we suggested selling into strength if the S&P 500 approached 1,700, and we noted that the S&P 500 was touching the upward boundary of the channel it had traded in since April 2010. This trend line was almost touched again in early August, and was followed by a 4.7% correction. This trend line is now near 1,730, which was approached again just after the Fed announced its decision not to taper. Bonds
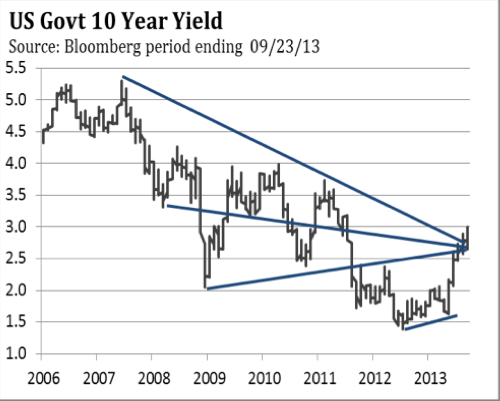
We noted in our August commentary that the bond market was ripe for a rally that at least tested the downtrend line from 2007. In our opinion, at a minimum, a decline in the 10-year U.S. Treasury yield to 2.70% is likely, with a chance it could fall to 2.50% if the Fed adopts a gradual approach to tapering. As of August 24, the 10-year yield has fallen to 2.65%.
Jim Welsh, David Martin, Jim O'Donnell
Macro Strategy Team
Definition of Terms 10-Year U.S. Treasury is a debt obligation issued by the U.S. Treasury that has a term of more than one year, but not more than 10 years.
RISKS Investing involves risk, including possible loss of principal. The value of any financial instruments or markets mentioned herein can fall as well as rise. Past performance does not guarantee future results.
This material is distributed for informational purposes only and should not be considered as investment advice, a recommendation of any particular security, strategy or investment product, or as an offer or solicitation with respect to the purchase or sale of any investment. Statistics, prices, estimates, forward-looking statements, and other information contained herein have been obtained from sources believed to be reliable, but no guarantee is given as to their accuracy or completeness. All expressions of opinion are subject to change without notice.
Jim Welsh is a registered representative of ALPS Distributors, Inc. Forward Funds are distributed by Forward Securities, LLC. ©2013 Forward Management, LLC. All rights reserved.
FSD000267 103114
|
| You are subscribed to email updates from The Big Picture To stop receiving these emails, you may unsubscribe now. | Email delivery powered by Google |
| Google Inc., 20 West Kinzie, Chicago IL USA 60610 | |


0 comments:
Post a Comment