


The Big Picture |
- The Pattern of Job Creation and Destruction by Firm Age and Size
- 2 Cellos – Thunderstruck
- Succinct Summations of Week’s Events 2.28.14
- How the Land Lies for U.S. Home Builders
- Hydrologic Cycle
- 10 Friday AM Reads
- Musk: Innovator or Rentier?
- Letter From Camp Kotok
- Where Time Comes From
| The Pattern of Job Creation and Destruction by Firm Age and Size Posted: 01 Mar 2014 02:00 AM PST By John Robertson and Ellyn Terry A recent Wall Street Journal blog post caught our attention. In particular, the following claim:
This observation is something we have also been thinking a lot about over the past few years (see for example, here, here, and here). The following chart shows the average job-creation rate of expanding firms and the average job-destruction rates of shrinking firms from 1987 to 2011, broken out by various age and size categories:
 In the chart, the colors represent age categories, and the sizes of the dot represent size categories. So, for example, the biggest blue dot in the far northeast quadrant shows the average rate of job creation and destruction for firms that are very young and very large. The tiny blue dot in the far east region of the chart represents the average rate of job creation and destruction for firms that are very young and very small. If an age-size dot is above the 45-degree line, then average net job creation of that firm size-age combination is positive—that is, more jobs are created than destroyed at those firms. (Note that the chart excludes firms less than one year old because, by definition in the data, they can have only job creation.) The chart shows two things. First, the rate of job creation and destruction tends to decline with firm age. Younger firms of all sizes tend to have higher job-creation (and job-destruction) rates than their older counterparts. That is, the blue dots tend to lie above the green dots, and the green dots tend to be above the orange dots. The second feature is that the rate of job creation at larger firms of all ages tends to exceed the rate of job destruction, whereas small firms tend to destroy more jobs than they create, on net. That is, the larger dots tend to lie above the 45-degree line, but the smaller dots are below the 45-degree line. As pointed out in the WSJ blog post and by others (see, for example, work by the Kauffman Foundation here and here), once you control for firm size, firm age is the more important factor when measuring the rate of job creation. However, young firms are more dynamic in general, with rapid net growth balanced against a very high failure rate. (See this paper by John Haltiwanger for more on this up-or-out dynamic.) Apart from new firms, it seems that the combination of youth (between one and ten years old) and size (more than 250 employees) has tended to yield the highest rate of net job creation. Source: Macroblog |
| Posted: 28 Feb 2014 04:30 PM PST Two Cellos. AC/DC’s Thunderstruck. NY Daily News: Luka Sulic and Stjepan Hause shred in 18th century-style costumes in the video, which has been viewed nearly 3 million times |
| Succinct Summations of Week’s Events 2.28.14 Posted: 28 Feb 2014 01:00 PM PST Succinct Summations week ending February 28, 2014 Positives:
Negatives:
Thanks, Batman |
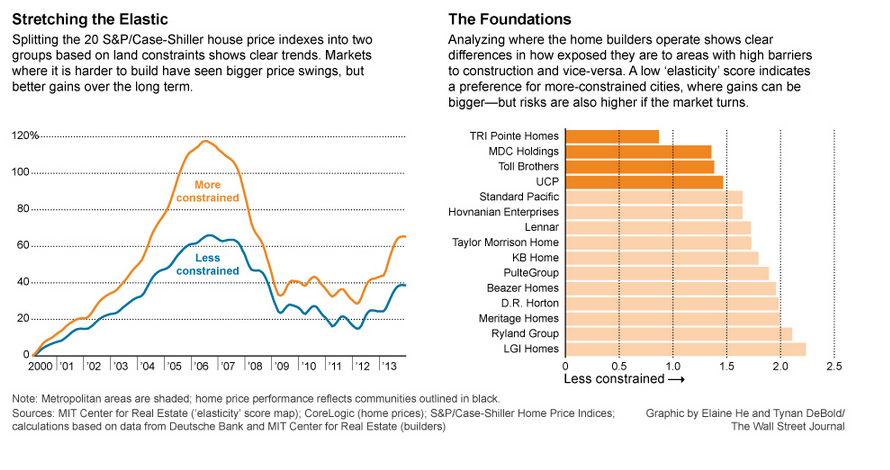
| How the Land Lies for U.S. Home Builders Posted: 28 Feb 2014 10:30 AM PST |
| Posted: 28 Feb 2014 09:30 AM PST
|
| Posted: 28 Feb 2014 07:30 AM PST My end of week reading:
|
| Posted: 28 Feb 2014 05:56 AM PST Income inequality has been a big theme in U.S. politics and economics recently. We discussed a mathematical anomaly about the 0.01 percent earlier in the month. A number of folks have offered up defenses of the wealthiest Americans, but they seem — like this rote piece from former Council of Economic Advisers Chairman Greg Mankiw — half-hearted and wimpy. What got me thinking about this recently was an intriguing article by University of Houston professor Craig Pirrong. In “The Rent Seeker, Posing as Visionary,” Pirrong criticized the long line of government-support programs that Elon Musk's many companies seem to be involved in. Rent-seeking has morphed over time: “Rentier” is derived from the French term to describe those who lived off the income from rents, typically for real estate. But that is morphing into income from government-enforced monopolies, such as patents, copyrights or government projects. The manipulation of regulations by lobbyists — particularly by those of the financial industry — has also given rise to claims of rent-seeking. |
| Posted: 28 Feb 2014 04:30 AM PST |
| Posted: 28 Feb 2014 03:00 AM PST The time that ends up on your smartphone—and that synchronizes GPS, military operations, financial transactions, and internet communications—originates in a set of atomic clocks on the grounds of the U.S. Naval Observatory. Dr. Demetrios Matsakis, Chief Scientist for USNO’s Time Services, gives a tour.
|


| You are subscribed to email updates from The Big Picture To stop receiving these emails, you may unsubscribe now. | Email delivery powered by Google |
| Google Inc., 20 West Kinzie, Chicago IL USA 60610 | |


0 comments:
Post a Comment