


The Big Picture |
- Bank Counterparties and Collateral Usage
- Saturday Night Cinema: Most Effective Edits of All Time
- John Oliver’s HBO Program is Astoundingly Viral
- Tweets of the Week 7.18.14
- 10 Weekend Reads
- Kiron Sarkar’s Weekly Report 19.7.14
| Bank Counterparties and Collateral Usage Posted: 20 Jul 2014 02:00 AM PDT Bank Counterparties and Collateral Usage
During the 2007–09 financial crisis, the degree to which financial institutions were linked through over-the-counter (OTC) asset markets was eye-opening and has since been identified as an important contributor to financial fragility. Financial firms have long been linked through traditional lending agreements. However, the connections created by more complex contracts, such as OTC derivatives and repurchase agreements, are more relevant to the risk these firms face because they are closely tied to the values of fast-moving financial variables. For these transactions, collateral—assets that can be seized in case of nonpayment—is stated as a standard contract term to mitigate credit losses in case a partner defaults. During the crisis, rapidly falling asset values, corresponding collateral calls, and stricter collateral requirements led to large losses and subsequent funding needs among financial firms. The degree of interconnection between firms caused these effects to spread more broadly and rapidly than expected. In the wake of the crisis, the Federal Reserve instituted new reporting requirements for bank holding companies (BHCs) with $10 billion or more in assets. These data provide insight into counterparties and collateral arrangements in these markets. In this Economic Letter, we examine the new data, particularly to learn more about the nature and diversity of collateral held by BHCs with their trading partners. In particular we find that, although BHCs have large exposure to banks, most of the collateral involved maintains minimal credit risk and is highly liquid. Conversely, contracts with corporations tend to use more diverse types of collateral, but the volume of these contracts is only one-quarter that of contracts with other banks. Moreover, the exposure to hedge fund counterparties is minimal and is collateralized by safe, liquid instruments. These initial findings suggest the new data source holds great promise for assessing future risk in OTC derivatives and other financial markets. Counterparty credit risk Our examination focuses on a broad category of arrangements known as over-the-counter (OTC) derivatives. An OTC derivative is a contract between two financial firms who agree to exchange cash flows based on the price of an underlying asset for a previously specified period of time. A classic example of such an agreement is an interest rate swap, in which one party agrees to exchange interest on a notional dollar amount at a prespecified, fixed rate for another party's interest earned on that same amount based on a floating market interest rate. OTC contracts are commonly used by large U.S. banks and are not subject to the same collateral requirements as some other agreements among firms. OTC derivatives may be consolidated through a master swap agreement between parties, as discussed in Duffie (2011) and Gregory (2010). These agreements usually conform to the standards set by the International Swaps and Derivatives Association (ISDA). Each agreement includes information not only on what type of collateral the counterparties can post, but also on the frequency and way collateral should be posted. For example, Gregory (2010) notes that collateral posted as part of derivatives contracts are generally valued at the current market rate. Such requirements are an important part of OTC deals, since posted collateral serves as a buffer against credit losses. Many factors can lead an institution to seek additional collateral from an already collateralized trade with a counterparty, a process known as a collateral call. In general, they fall into three categories. First, the amount of risk exposure in the trade might increase relative to the collateral already posted. This is generally due to recent price changes for the asset underlying the derivative. A second possibility arises when the credit quality of a counterparty declines, increasing the likelihood of default. The most famous example of this type of collateral call was the collapse of Lehman Brothers Holdings in the fall of 2008. Third, the value of the collateral already posted might drop relative to the amount of risk exposure. As discussed in Duffie (2011) and Gorton and Metrick (2012), this last form of collateral call was ubiquitous during the most recent crisis. Collateral calls not only became more frequent as asset prices declined, but the range of acceptable collateral was also severely restricted to only the most liquid and safe securities. This exacerbated the stress and "fire sales" that financial markets were already witnessing. Because reporting requirements weren't capturing data on bank interconnectedness or BHCs' derivative portfolios before the crisis, researchers have had fewer data available to explore these types of events. Since then, revised Federal Reserve reporting requirements have gathered a wealth of data on these agreements. We use this new source to shed some light on more recent transactions, specifically what types of collateral banks are now receiving most frequently across different sets of counterparties for different types of OTC exposures. Data on collateral
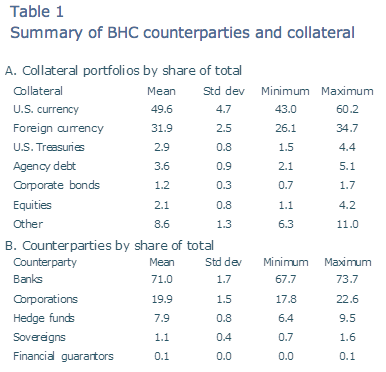
Starting in the second quarter of 2009, BHCs with total assets of $10 billion or more were required to fill out a new reporting schedule of the Consolidated Financial Statements for Bank Holding Companies (FR Y-9C). Schedule HC-L covers the total net credit exposure between a set of counterparty types, as well as what types of collateral they post for their OTC derivatives. The instructions for the FR Y-9C define the process for determining net credit exposure as follows: "Determine whether a legally enforceable bilateral netting agreement is in place between the reporting bank holding company and the counterparty. If such an agreement is in place, the fair values of all applicable derivative contracts with that counterparty that are included in the scope of the netting agreement are netted to a single amount, which may be positive, negative, or zero." Moreover, BHCs are required to distinguish exposures across five counterparty types: banks and securities firms, monoline financial guarantors, hedge funds, sovereign governments, nonfinancial corporations, and all others. The category for monoline financial guarantors includes companies that insure principal and interest payments to bondholders when a bond issuer defaults. As described earlier, collateral calls are a key way to guard against risk exposure in OTC contracts. Therefore, banks are also required to report the dollar amount of each collateral type posted in these agreements. The seven types of collateral are U.S. currency, foreign currency, U.S. Treasuries, U.S. government agency debt, corporate bonds, equity securities, and all others. Table 1 gives aggregated data for collateral and trading partners in the market from the second quarter of 2009 through the first quarter of 2013. The top panel shows the type of collateral BHCs accepted according to its share of the total dollar amount of collateral, and the bottom panel shows the types of counterparties involved with BHCs according to the share of the total dollar amount of transactions by all reporting banks. We count only those BHCs that reported their transactions for the entire period we study, which includes 84 institutions. Data summary
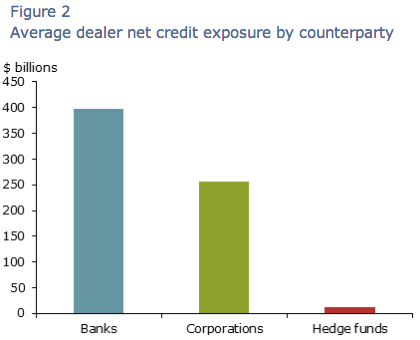
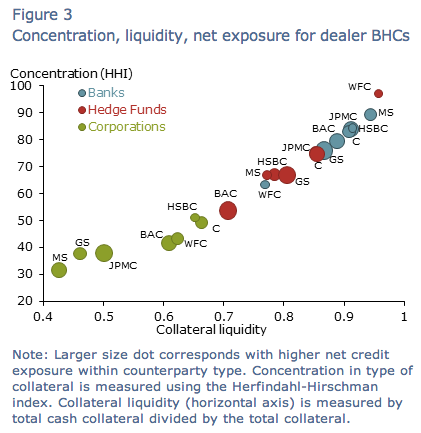
In our analysis, we first distinguish between whether banks are dealers or not. As defined in Duffie (2011), dealer banks serve as the main providers of securities and OTC derivatives for market participants. As such, we should expect BHCs that operate as dealer banks to face larger net credit exposure than other banks. Figure 1 corroborates this, displaying the average net exposures of dealer BHCs compared with non-dealers. On average, dealer banks have exposures more than 10 times larger than non-dealer BHCs. This magnitude confirms dealer banks are the major recipients of collateral, so we focus on these institutions for the remainder of our analysis. We concentrate on the three largest sets of counterparties: banks, corporations, and hedge funds. In Figure 2, we show the average net credit exposure for each counterparty type across all dealer BHCs. The figure clearly shows that on average such institutions are faced with much larger exposures to other banks and corporations than to hedge funds. Although net credit exposure can be very informative for measuring interconnectedness in the derivatives markets, it gives no insights into how dealers manage risk. As mentioned earlier, a natural way to mitigate such risk would be to monitor the quality and amount of posted collateral. Figure 3 summarizes dealers' positions in their contracts with other types of institutions in terms of risk exposure and collateral. In Figure 3, the size of a circle indicates the relative size of the net credit exposure for dealers' average exposures to corporations (green dots), hedge funds (red dots), and banks (blue dots). The figure also shows a measure of the concentration of collateral across types on the vertical axis, with all cash collateral folded into a single category. The higher the value on this axis, the less diversified the average collateral pool is for a particular counterparty. The horizontal axis measures the shares of collateral according to how liquid it is, with higher values being more and lower values being less liquid. We first note that collateral posted by corporations is usually less concentrated in one type, and usually comes from less liquid assets when compared with other counterparty types. Second, for hedge funds, although cash is the most popular form of collateral, Treasuries and other types of collateral are also widely used. This corroborates the findings of Gorton and Metrick (2012), since this category encompasses assets whose prices were severely affected during the financial crisis, such as commercial and residential mortgage-backed securities and collateralized debt obligations. Note however that the aggregate exposure to hedge funds is significantly smaller than the amounts observed for banks and corporations. Conclusion
In this Letter, we have shown that bank holding companies have large exposures to other banks and corporations in the market for over-the-counter derivatives. However, hedge funds and banks generally post collateral that is concentrated in very liquid and safe assets. In particular, bank counterparties seem to primarily use cash as collateral. Corporations post a much more diversified collateral pool, but the value of their posted collateral, as shown in the table, is roughly 75% less than that of banks. Contrary to common belief, the new data also show that banks' trading exposure with hedge funds not only maintain, on average, more collateral than the value of the exposure, but they also hold a large percentage of their collateral in the form of cash. This type of information can play an important role in understanding the linkages among derivatives markets and provide valuable insights for formulating policy to ensure financial stability. Based on initial data from the new reporting requirements, the collateral pools held by U.S. bank holding companies since 2009 appear much more adequate than they were leading up to the financial crisis. Clearly, there are many more aspects of the OTC market and other markets to examine, but having these data available will make it significantly easier for researchers and regulators to understand the structure and dynamics of financial markets. Hamed Faquiryan is a research associate in the Economic Research Department of the Federal Reserve Bank of San Francisco. Marius Rodriguez is an economist in the Economic Research Department of the Federal Reserve Bank of San Francisco. References Duffie, Darrell. 2011. How Big Banks Fail. Princeton, NJ: Princeton University Press. Gorton, Gary, and Andrew Metrick. 2012. "Securitized Banking and the Run on Repo." Journal of Financial Economics 104(3), pp. 425–451. Gregory, Jon. 2010. Counterparty Credit Risk: The New Challenge for Global Financial Markets. West Sussex: John Wiley and Sons. |
| Saturday Night Cinema: Most Effective Edits of All Time Posted: 19 Jul 2014 05:00 PM PDT Skilled editing is as effective in the creation of a good film as a writer, director, or performer. Though often overlooked, editing brings shots together to make a whole greater than the sum of its parts. These ten movies are a fantastic illustration of just how important editing can be.
THE LIST City of God Bonnie and Clyde North By Northwest: The Godfather Battleship Potemkin Psycho Un Chien Andalou Apocalypse Now 2001: A Space Odyssey Lawrence of Arabia |
| John Oliver’s HBO Program is Astoundingly Viral Posted: 19 Jul 2014 01:00 PM PDT Fix the teeth, make it shorter and lie about your age. Is John Oliver breaking all the rules or is the truth there are no rules to begin with? What we know is you’ve go to appeal to the younger generation, oldsters don’t switch products, advertisers are not interested, if you’re not shooting for tweens and teens, we don’t care. And god help us be beautiful. Isn’t that the Fox News mantra? If you find a guy who doesn’t want to bang Megyn Kelly, he’s gay. If you’re gonna hire a lawyer, one who’s actually smart, why not get someone beautiful? Yup, no ugly people on TV. And don’t you know that kids have a short attention span? I mean you’re gonna talk about income inequality for fourteen minutes? Everybody’s gonna tune out, no one cares, can’t you throw in some cute dogs or cats while you’re at it, and a feel good moment too? But no, John Oliver is British. So he’s self-deprecating and can verbalize the truth everyone in America is afraid to utter. That’s right, the mayor of Los Angeles utters the F-word and it dominates the news for two weeks, as if no one over twenty ever swears. And there’s the fiction that there are two reasonable sides to every story. As if every time someone’s bleeding to death, we should call in the Christian Scientists for their take. No, the truth is everybody knows what’s real, and it’s beyond refreshing to have someone in a position of power utter it. That’s what John Oliver is, a truth-sayer. Who’s been doing his job for decades. Wait a minute? Don’t we revere the barely pubescent, who haven’t even had their first kiss? Old means worthless in America, over the hill old man, we don’t want to hear your opinions. And the hilarious thing is the old people buy it, they diet down to nothing, wear their children’s clothing and imitate their lifestyle. Why else to get plastic surgery other than to evade the aging police. It’s like the whole country’s living “Logan’s Run,” but no one will admit it. And they also won’t admit that with age comes wisdom, which grows from experience. You live and you learn, but most people don’t learn to let the epithets of the youngsters slide off of them. They feel inadequate themselves, when the youngsters say they are they don’t own their identity, they change it. The virality of John Oliver’s HBO program is astounding. And it’s all because he’s firing on all cylinders. To watch Oliver’s show is to wait for the lull, the mediocre interlude, that permeates sitcoms, that’s dominates society. It’s like watching an acrobat, or a tightrope walker, we’re on the edge of our seats, just waiting for him to fall. But Oliver keeps cruising along at an insightful comedy altitude that’s jaw-dropping. Which is why everybody’s talking about him, e-mailing clips about him. Yup, you’ve just got to be that good. I mean you watch Oliver and you damn near have a heart attack, it’s akin to watching the Beatles or Richard Pryor, if Richard Pryor did not only talk about race and his life, but politics. We’re drawn to excellence. But everybody who’s less than wants attention. Which means we wait to see what rises above. And John Oliver has risen above. Income inequality. Even the Republicans now admit it’s a problem. But it’s a television third rail, because of “class warfare.” Huh? There’s already class warfare, why worry about the moniker? And Oliver addresses this too. Now his fourteen minute diatribe on income inequality is not quite as good as his shorter evisceration of climate change deniers, but… He starts with a joke, analogizing income inequality to whether you’re stealing or paying for HBO, while he’s on HBO! You won’t get a musician to disparage his label, to poke holes in its business model, to criticize it as being antique unless said musician wants off. Then, like a roller coaster, there are popular culture references and history and a refusal to be all or nothing, as in stating that true equality is a pipe dream. And then there’s the skewering of America’s inane optimism, wherein if you’re not a winner, or on your way to victory, you’re a base whiner who must be shouted down and removed from the debate, you’re a hater trotting out facts without concrete solutions so please get out of my way as I delusionally work twenty hours a day pursuing victory at a casino wherein the house always wins. It’s like an album where all ten cuts are winners, where there’s no bait and switch, where when you’re done you want more. It turns out that we’re not interested in exterior, but interior, that everything being told and sold to us is wrong. You don’t have to be beautiful, your father doesn’t have to be rich, but to triumph you’ve got to be smart, experienced and creative. Oliver fights with facts, wrapped up in a presentation so good that it doesn’t rely on said facts. It’s like Eric Clapton not needing to whip out a lick because the song is so good, his guitar playing is secondary. So when you gonna wake up? That’s right, once upon a time we relied on Bob Dylan and other musicians to speak the truth. But that no longer happens. Instead we must watch cartoons and comedians. You’ll get more honesty on “South Park” than you will on the nightly news. And it’s lucrative too, just check out “Book Of Mormon.” So keep telling yourself the game has changed, that the old values are out the window, that everybody’s got a short attention span and we live in a hit and run society wherein Britney Spears is already too old and we need someone much younger to replace her. You need no money to speak your mind. You need no money to be good. But if you pay your dues, those supposedly against you will embrace you, HBO will pay John Oliver to skewer the establishment. And the end result will be of such high quality that the unwashed masses will lift you above and beyond, you will become a superstar with credibility. Which is a far cry from what we’re featuring on today’s hit parade. There is hope. “Last Week Tonight with John Oliver: Wealth Gap” “Last Week Tonight with John Oliver: Climate Change Debate” ~~~ – |
| Posted: 19 Jul 2014 08:30 AM PDT Our weekly Tweet round up:
Markets/Investing H2w0w New England is Gassy US Post Office Retirement Accounts Cooperman on the Modern Fund Manager
Economy Sweet Rising Seas Look
Politics/Policy Airlines Were Avoiding Ukraine Airspace Thank you for not smoking Pay for Armed Forces Medical Care Obama Cures Cancer Book LOL That's one way to look at it
Random Items Milky Way Modern Tanlines No PhotoShop involved Beats my best God's View of Religion's Subjectivity |
| Posted: 19 Jul 2014 05:00 AM PDT Pour a tall cup of joe, settle in to your favorite easy chair, and enjoy our longer-form reads to begin your Saturday:
Whats up for the weekend?
S&P 500 P/E Since 1900 |
| Kiron Sarkar’s Weekly Report 19.7.14 Posted: 19 Jul 2014 03:30 AM PDT China's GDP rose by a better than expected +7.5% in Q2 Y/Y and was welcomed by markets. The improvement reflects the stimulus programme undertaken by the government and the sharp rise in lending, once again, as a result of government policy. The government’s actions suggests that they will continue with their stimulus programme/increased lending if the economy weakens. However, the associated increase in credit will just add to China's problems in the future. Whilst just 1 months number, the much higher than expected UK June CPI reading increases the chance of the Bank of England (BoE) raising rates this year, which clearly will be positive for Sterling. The minutes of the next few meetings will reveal whether some members vote for an earlier rate hike, which I expect will be the case. The US and to a lesser extent the EU, have increased sanctions on Russia as a result of the situation in the Ukraine. The US imposed sanctions against 4 of Russia’s major companies, which will limit their access to financing from the international capital markets, other than short term financing. Mrs Merkel has been pressing the EU to ratchet up sanctions, even though it will hurt German businesses. The downing of a commercial aircraft just increases the possibility of a further ratcheting up of sanctions. A speedy solution to this problem does not look likely. Clearly, European markets are the most affected, with the German DAX vulnerable. The Israeli incursion into Gaza also increases the geopolitical risks, as does the continuing conflict in Iraq and Syria. However, whilst potentially serious problems, equity markets have not reacted noticeably to the increase in tensions though, unsurprisingly, bond yields declined, with the US 10 year down to 2.48%. Unless the various crises escalate, it looks as if equity markets will continue to drift higher. Results of US companies during the current earnings season have been positive, which also helps to support markets. The Euro has continued to weaken, though I expect that it has further to go. I wouldn’t be surprised if the Euro declines to below US$1.30 over the next few months. Sterling should also benefit. US Interestingly, the NAHB home builders sentiment index rose to 53 in July, from 49 in June, finally moving into positive territory. However, June housing starts came in at an annualised rate of 893k, lower than the 1.02mn expected and the downwardly revised rate of 985k the previous month. Construction plunged in the South, where starts declined by nearly 30%. The other regions were all positive. Building permits came in at 963k, lower than the 1.035mn expected and the upwardly revised rate of 1.005mn in May. The housing data in the South was particularly bad and runs counter to recent evidence of an improvement in the sector, which suggests it could be a rogue number. US retail sales rose by +0.2% in June M/M, lower than the upwardly revised +0.5% increase in May and the forecast for a rise of +0.6%. Excluding autos, petrol and building materials, sales rose by +0.6%, the most since March. The main reason for the lower than expected headline number was due to a reduction in auto sales. June producer prices increased by +0.4% M/M (+1.9% Y/Y), higher than the rise of +0.2% expected and as compared with the -0.2% decline in May. The higher cost of fuel, which should reverse this month, resulted in the larger than expected increase. Core prices (ex food and fuel) rose by +0.2% (+1.8% Y/Y), in line with forecasts. US industrial production rose by +0.2% in June, lower than the revised rise of +0.5% in May and the estimate for a rise of +0.3%. However, production rose by an annualised rate of +5.5% in Q2, the highest since Q3 2010. Foreign investors are buying US bonds once again. TIC data reveals that foreign investors bought a net US$34.6bn of US Treasuries in May, which represented virtually the total net monthly inflow of capital into the US of US$35.5bn. US investors were still net purchasers of foreign securities, though the amount (US$15.2bn) was the lowest in the last 3 months. Weekly jobless claims declined to 302k, lower than the forecast of 310k and the prior week’s 305k. The less volatile 4 week moving average declined to 309k, the lowest since June 2007 and down from 312k the previous week. The Philly Fed manufacturing survey was particularly positive. The index of current activity rose to 23.9 this month, up from 17.8 in June and the forecast of 15.5. The new orders and shipment components rose materially, suggesting that the improvement should continue. Europe UK inflation (CPI) rose to +1.9% Y/Y in June, up from +1.5% in May and the forecast of +1.6%. The higher than expected level of inflation, especially if maintained, will put pressure on the BoE to increase rates sooner than it would like, quite possibly as early as Q4 this year. UK June retail sales declined by -0.8% according to the British Retail Consortium, well below the rise of +0.7% expected and the rise of +0.5% in May. However, discounting by supermarkets, in particular, could have impacted the numbers. UK unemployment fell to its lowest level in over 5 years. As expected, the unemployment rate declined to 6.5% in the 3 months to May. However, wage growth slowed to +0.3% in the 3 months to May, down from +0.8% in April. More recent surveys suggest that pay should start rising above inflation in coming months. Japan The Japanese government raised its economic outlook for the 1st time in 6 months, on the basis that the impact of the sales tax hike was fading and that consumption should increase in coming months. With wage growth below inflation, the government’s forecast seems optimistic. China Chinese GDP rose by +7.5% in Q2 Y/Y, slightly higher than the +7.4% expected and the +7.4% in Q1. Industrial production increased by +9.2% Y/Y, above the forecast for a rise of +9.0% and the +8.8% in May. Retail sales increased by +12.4% Y/Y, marginally lower than the forecast of +12.5%. Fixed asset investment, excluding rural households, rose by +17.3% in the 1st half of the year Y/Y. It is clear that government policies, including a stimulus programme, combined with increasing the amount of credit, has helped to avoid a material slowdown of the economy. The question is whether this is sustainable without further stimulus. Furthermore, Chinese data is unreliable, with a number of analysts, including myself, sceptical as to the reported growth in GDP. Chinese new home prices declined in 55 out of 70 major cities in June M/M, the most since early 2011. The problem is the high level of unsold properties. A number of developers face serious cash flow problems and further discounting looks likely. The government has urged the provinces to deal with the inventory overhang and, in addition, urged lenders to increase mortgage lending. Previous curbs on property purchases have also been abandoned. Other Kiron Sarkar |


| You are subscribed to email updates from The Big Picture To stop receiving these emails, you may unsubscribe now. | Email delivery powered by Google |
| Google Inc., 20 West Kinzie, Chicago IL USA 60610 | |


0 comments:
Post a Comment