


The Big Picture |
- Neighborhood Gentrification during the Boom and After
- The Losers From U.S. Sanctions: AMERICAN Businesses
- Priceonomics: Everything is Bullshit
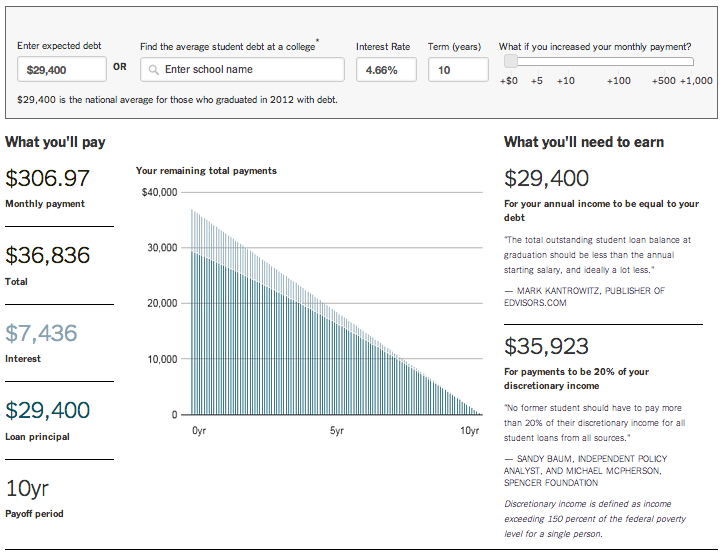
- Student Loan Calculator
- Masters in Business: Rob Arnott of Research Affiliates
- 10 Sunday Morning Reads
- Apollo 11 Retrospective: ‘One We Intend To Win’
| Neighborhood Gentrification during the Boom and After Posted: 21 Jul 2014 02:00 AM PDT Neighborhood Gentrification during the Boom and AfterDaniel Hartley and Daniel Kolliner During the housing boom, a number of large cities in the United States experienced redevelopment in their lower-income neighborhoods as higher-income residents moved in, a process known as gentrification. Looser lending standards, which were prevalent at the time, may have contributed to the trend. Since lending standards have tightened with the onset of the housing bust and the financial crisis, we wondered whether gentrification has continued after the recession in places where it was happening before. To answer this question, we examined how the income rankings of neighborhoods in the centers of metropolitan areas have changed relative to those in the suburbs since 2000. Looking at how average incomes have shifted in city neighborhoods compared to the suburbs allows us to see which metropolitan areas are experiencing income growth in their core relative to their periphery. We find that for the cities with the largest gains, the growth is driven primarily by lower-income city neighborhoods moving up in the income distribution of the metropolitan area. Such a pattern is consistent with gentrification, where higher-income residents move in to formerly low-income neighborhoods. We selected a set of 59 large cities, all of which had a population above 250,000 in the year 2000 and the largest population of their respective metropolitan area (many metro areas include more than one city). Then we ranked the census tracts of each metropolitan area by the average income of residents in the tracts. The rankings are percentiles, running from 1 to 100. Finally, we took the mean of these rankings for the tracts that are located in the largest city of the metropolitan area (referred to as the principal city in the charts below). This mean gives a sense of where the tracts of the largest city as a whole fall in the income distribution of the metropolitan area. For example, the average tract in the city of Virginia Beach was at the 66th percentile of all of the tracts in the Virginia Beach-Norfolk-Newport News metropolitan statistical area, while the average tract in the city of Newark was at the 18th percentile in the Newark, NJ-PA metropolitan division. This means that the average tract in Virginia Beach is higher income than the average suburban tract, while the opposite is true in Newark. To get a sense of the degree to which center-city neighborhoods are moving up in income rankings compared to their suburbs, we look at how these means have changed over time. We use tract-level data from the 2000 Census, the 2005-2009 American Community Survey, and the 2008-2012 American Community Survey, though for simplicity we refer to the periods these data cover as 2000, 2007, and 2010. From 2000 to 2007 Atlanta showed the largest increase in mean income ranking of all the 59 cities, moving up 8.7 percentiles. Washington was second with an increase of 5.0 percentiles. The biggest drops were in Tulsa (−3.6) and Omaha (−2.7).
From a map of income rankings in the city we can gather where the income shifts are occurring. In Atlanta, income is rising, relative to the metropolitan area, near the central business district, in midtown, and on the east side.
To examine whether the gentrification trends of the pre-recession boom period extended into the bust and recovery, we plot the changes in the mean income ranking from 2007 to 2010 against the changes in the mean income ranking from 2000 to 2007. It should be noted that we might expect to see smaller changes in income from 2007 to 2010 since it is a period of only three years, while 2000 to 2007 is seven years. We must make do with the shorter post-boom period, since that is the extent of the tract-level data that is available. For a few cities (Denver, Minneapolis, Portland, Seattle, and Washington), the increase in income ranking continued after the boom, rising 2 to 3 percentiles from 2007 to 2010. By contrast, the large increases in income ranking in the city of Atlanta during the boom years were not matched in the subsequent period. Another interesting case is Cincinnati, which barely changed in income ranking from 2000 to 2007 but has increased at a pace similar to Denver or Washington during the 2007 to 2010 period.
In Washington, the city center's income growth is more pronounced from 2000-2007; however, the same general trend occurs from 2007-2010. The tracts located in the middle of the city have had larger changes in income ranking for both periods. Surrounding the middle of the city are areas where the income ranking has declined or grown slowly.
In order to get a sense of whether the changes in income rankings of the center cities that we observe are being driven by neighborhoods that were initially lower income or initially higher income, we also looked at the changes in income ranking using only low-income census tracts (those that were in the bottom half of the metropolitan-area distribution). Much of the mean change in income rankings in the large cities we studied is being driven by lower-income neighborhoods moving up in the distribution, a pattern consistent with gentrification. It appears that gentrification continued despite the bust in cities such as Denver, Minneapolis, Portland, Seattle, and Washington, while in Atlanta it ground to halt. The variation may be due to the fact that that the financial crisis and housing bust had different effects on different industries. Since metropolitan areas specialize in different things, the effects of the crisis and bust played out in different ways across regions. Source: Federal Reserve Bank of Cleveland |
| The Losers From U.S. Sanctions: AMERICAN Businesses Posted: 20 Jul 2014 10:30 PM PDT U.S. Sanctions Against Foreign Nations Are Hurting American CompaniesWho are the losers from U.S. sanctions? American companies. Two giant U.S. business groups – the U.S. Chamber of Commerce and National Association of Manufacturers – ran ads in the New York Times, Wall Street Journal and Washington Post protesting sanctions against Russia. These are not do-good political groups … they are conservative, hard-nosed pro-business groups. The New York Times reports today:
Zero Hedge notes that the sanctions don't seem to have hurt Russia much:
U.S. News and World Report pointed out in April:
Bloomberg also reports that American power plants are "desperately" turning to Russia for their coal. And sanctioning Russia has also pushed Russia to bypass US-controlled oil and gas systems altogether, and pushed Russia, China and Iran closer together. The Wall Street Journal reports that – according to a new study – sanctions against Iran cost the U.S. as much as $175.3 billion in lost export opportunities over 18 years In other words, by demonizing countries instead of peacefully trading with them, the U.S. is shooting itself in the foot economically. This is not an isolated problem … Ron Paul says that sanctions against Russia and Iran are acts of war. Some analysis agree and others disagree. But it has become clear that hawkish, imperialistic policies no longer benefit the American economy:
|
| Priceonomics: Everything is Bullshit Posted: 20 Jul 2014 06:00 PM PDT I am about halfway through this, whose title reminded me of Sturgeon’s Law (90% of Everything is Crap):
Check it out on Amazon. |
| Posted: 20 Jul 2014 01:00 PM PDT Click to get calculating. |
| Masters in Business: Rob Arnott of Research Affiliates Posted: 20 Jul 2014 07:00 AM PDT Rob Arnott turned the world of passive index investing upside down. Best known for creating "smart beta," Arnott creates models weighted b y four factors: Sales, profits, book value and dividends. Market cap is not relevant to him. Funds running Arnott's models manage about $200 billion dollars in smart-beta strategies. Assets have increased by 59 percent last year. You can stream the full interview — radio + podcast — with Arnott here; we should have the MP3 of the interview up later this week. This is the second episode in our new series “Masters in Business” that I’ve created with Bloomberg Radio and Bloomberg View. Our goal is to turn the usual Wall Street interview show upside down by ignoring short-term market concerns and focusing instead on how some of the modern masters in business and finance developed their personal philosophies and strategies. You can listen to “Masters in Business” on Bloomberg AM on weekends and nationally on Sirius XM channel 119. Listen to last week’s interview with Jeff Gundlach on SoundCloud, and check back next week for a chat with Arthur Levitt.
You should listen to this despite that terrible picture . . . |
| Posted: 20 Jul 2014 05:00 AM PDT My Sunday morning reads:
What’s for brunch?
Asia’s Rising Resilience to Oil Prices
|
| Apollo 11 Retrospective: ‘One We Intend To Win’ Posted: 20 Jul 2014 03:00 AM PDT
|


| You are subscribed to email updates from The Big Picture To stop receiving these emails, you may unsubscribe now. | Email delivery powered by Google |
| Google Inc., 20 West Kinzie, Chicago IL USA 60610 | |


0 comments:
Post a Comment