


The Big Picture |
- Inflation Was Much Higher Pre-Crisis than Post-Crisis
- 10 Monday PM Reads
- Does Increased M&A = Potential Market Top ?
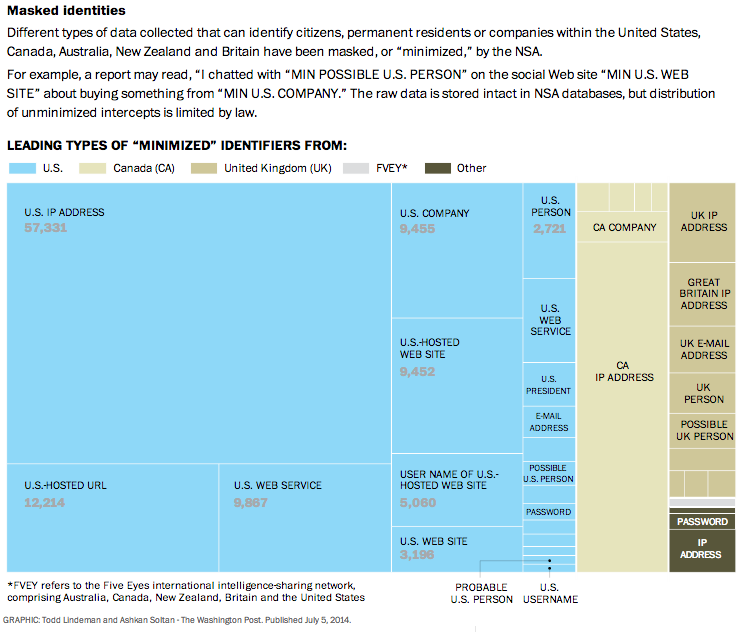
- NSA Communication Breakdown
- 10 Monday AM Reads
- Confessions of an Inflation Truther
- Tapering Is Now Tightening
| Inflation Was Much Higher Pre-Crisis than Post-Crisis Posted: 21 Jul 2014 05:31 PM PDT click for ginormous chart
Sorry, but the data says that is simply not true. Play with the attached FRED chart chart and XL spread sheet all you want, the data is hard to argue with. (Same goes for energy, especially Oil), Cherry pick whatever time period you want. From 2000 to the end of 2008, Food at home averaged 3.00% year over year increases; since 2009 until today, its only been 1.78%. With Oil, its much more dramatic: Oil averaged 24.9% year over year price increases from 2000 to 2008; Since 2009, its averaged a far more tame 6.5%. Spreadsheet: Inflation Food at home FRED |
| Posted: 21 Jul 2014 01:30 PM PDT My afternoon train reads:
What are you reading?
Average Hourly Earnings of US private sector, YOY change |
| Does Increased M&A = Potential Market Top ? Posted: 21 Jul 2014 11:00 AM PDT FT: When investors are complacent, stupid deals happen
Last week, I pointed out some statistical errors in a chart suggesting that Rupert Murdoch's bid for Time Warner was a sign of the market's top. The chart had enough omissions to render it useless. Today, I want to show you a (slightly) better version of the same idea. Continues here
|
| Posted: 21 Jul 2014 09:00 AM PDT |
| Posted: 21 Jul 2014 07:00 AM PDT My Monday morning train reads (continues here):
|
| Confessions of an Inflation Truther Posted: 21 Jul 2014 06:00 AM PDT There is a group of folks who believe that inflation is much higher than the numbers in the official reports. Paul Krugman calls them "inflation truthers." In the 2000s, I might have been considered part of that crowd. I recognized that inflation data wasn’t being reported accurately, and said as much. I coined the phrase "inflation ex-inflation" to show the absurdity of reporting inflation data without food and energy prices, which were rising fast then. Owner's equivalent rent, hedonic adjustments, substitution all were rightly criticized as flaws in the consumer price index model. The key difference between the truthers of 2010s and those of the 2000s is what each group has criticized and toward what purpose. The 2000s truthers were critics of the inflation mathematical model used by the U.S. Bureau of Labor Statistics (more on this later); the 2010s truthers are critics of President Barack Obama, and any economic gains under his watch therefore must be the result of inflation. Today’s truthers include the site shadowstats.com, whose methodology was thoroughly debunked by John Aziz. Yet even conservative Ramesh Ponnuru, my colleague at Bloomberg View, has called those who believe that hyperinflation is running amok, "inflation cranks." Continues here
|
| Posted: 21 Jul 2014 03:00 AM PDT Tapering Is Now Tightening
For a long time, as we saw it, tapering and the threat of tapering (as in last year's taper tantrum) did not constitute tightening. Today we explore why we believe the situation has now changed. In order to understand why tapering was not tightening initially, we must momentarily set aside all influences on US Treasury note and bond interest rates that fall outside of the Federal Reserve's program. Pretend for a minute that foreign exchange flows, geopolitical risks, inflation expectations, deflation expectations, sovereign debt biases, preferred habitat buyers, and a million other things are all neutral. They never are, but for this exercise pretend that they are so. We have observed and commented on QE and the expansion of the Federal Reserve's balance sheet for several years, as the Fed emphasized intermediate- and long-term maturities as a mechanism by which to absorb the net issuance of US Treasury securities. Let's think of it this way. The federal deficit was $1 trillion, and the Fed was buying securities at the rate of $85 billion per month, or approximately $1 trillion yearly. Thus, the Fed purchased the entire amount of issuance that the federal government presented to the market. If all things were otherwise neutral, the market impact was zero. There was no influence to change interest rates; hence they could stay very low. But in the economic recovery phase, the federal deficit commenced shrinking sooner than the Fed commenced tapering. There reached a point at which the Fed was acquiring more than 100% of the net new issuance of US government securities. At that point, the Fed's buying activity was withdrawing those securities from holders in the US and around the world. Essentially the Fed was bidding up the price and dropping the yield of those Treasury securities, and it was doing so in the long-duration end of the distribution of those securities. The Fed has taken the duration of its assets from two years prior to the Lehman-AIG crisis all the way out to six years, which is the present estimate. It is hard to visualize the Fed taking that duration out any farther. There are not enough securities left, even if the Fed continues to roll every security reaching maturity into the longest possible available replacement security. We can conclude that the duration shift, otherwise known as a "twist," is over. A six-year duration of the Fed's balance sheet is about all one can reasonably expect them to obtain. Now the Fed commences the tapering process, incrementally stepping down its purchases of $85 billion per month to lesser amounts. The Fed has said that it will complete that task and reach zero before the end of this year. The target month is October. The current rate of purchases is $35 billion a month, or approximately $400 billion at an annualized run rate. The federal deficit has declined as well. Because of the shrinkage of the deficit, the run rate of Fed purchases and issuance by the US government are still about the same as the amount of Fed purchases. Before, the balance was $1 trillion issued and $1 trillion absorbed by the Fed. Presently, it is approximately $400 billion issued and $400 billion absorbed by the Fed. The Fed is on a glide path to zero, but the deficit remains a long way from zero. In July, August, September, and October of this year, for the first time, the net issuance of US government securities will exceed the absorption by the Fed as it tapers. The process of tapering is a gradual one that has been discussed by Fed officials continuously, and it is clear that, in the absence of some extreme reaction, they are going to sustain this path. What does that mean? By autumn, we will see issuance of US government securities at a rate of somewhere close to $400 billion annualized, whereas Fed absorption will be at zero. The Fed will continue to replace its maturities, but that practice will not add duration or supply any stimulus. In July, August, September, and October, for the first time, the change in rate between what the Fed absorbs and what the Treasury issues will result in a shift. That shift is a tightening. Will the markets respond to that tightening? We do not know. Have they responded to similar shifts in history? Absolutely. Could the shift be dramatic? We do not know. Could the response be benign? Yes. Could the response increase volatility and intensify market reactions to other events, many of which we have, for the purposes of this discussion, been assumed to be neutral? Absolutely. We are about to get back to a neutral place. The neutral place means the impact of issuance of debt by the government will again become a significant factor even if the rate is $400 billion per year. The other factors that we listed above and many more that have not been listed here are about to become more direct and substantial influences on interest rates. The reality is that their effects over the last seven years have been dampened by Fed policy. The effect of Fed policy on US-denominated assets has been to create a continued upward bias in the prices of those assets. Stocks, bonds, real estate, collectibles, and any asset that is sensitive to interest rates have had the benefit of this extraordinary policy for five or six years. That support is coming to an end. At Cumberland, we have no idea whether the transition will be benign and gradual or abrupt and volatile. There is no way to know. Therefore, we have taken a cash reserve position in our US ETF and US ETF Core accounts. We are maintaining that position as we navigate this transition period of July, August, September, and October. After years of stimulus, we've reached a tipping point that remaps the investing landscape in ways we cannot clearly foresee: for the rest of this year, tapering will be tightening. ~~~ David R. Kotok, Chairman and Chief Investment Officer |


| You are subscribed to email updates from The Big Picture To stop receiving these emails, you may unsubscribe now. | Email delivery powered by Google |
| Google Inc., 20 West Kinzie, Chicago IL USA 60610 | |


0 comments:
Post a Comment