


The Big Picture |
- Perspectives on Inequality and Opportunity from the Survey of Consumer Finances
- Big Hero 6
- Execution
- MiB: Paul Krugman
- 10 Weekend Reads
- Kiron Sarkar’s Weekly Report
| Perspectives on Inequality and Opportunity from the Survey of Consumer Finances Posted: 26 Oct 2014 02:00 AM PDT Chair Janet L. Yellen
The distribution of income and wealth in the United States has been widening more or less steadily for several decades, to a greater extent than in most advanced countries.1 This trend paused during the Great Recession because of larger wealth losses for those at the top of the distribution and because increased safety-net spending helped offset some income losses for those below the top. But widening inequality resumed in the recovery, as the stock market rebounded, wage growth and the healing of the labor market have been slow, and the increase in home prices has not fully restored the housing wealth lost by the large majority of households for which it is their primary asset. The extent of and continuing increase in inequality in the United States greatly concern me. The past several decades have seen the most sustained rise in inequality since the 19th century after more than 40 years of narrowing inequality following the Great Depression. By some estimates, income and wealth inequality are near their highest levels in the past hundred years, much higher than the average during that time span and probably higher than for much of American history before then.2 It is no secret that the past few decades of widening inequality can be summed up as significant income and wealth gains for those at the very top and stagnant living standards for the majority. I think it is appropriate to ask whether this trend is compatible with values rooted in our nation’s history, among them the high value Americans have traditionally placed on equality of opportunity. Some degree of inequality in income and wealth, of course, would occur even with completely equal opportunity because variations in effort, skill, and luck will produce variations in outcomes. Indeed, some variation in outcomes arguably contributes to economic growth because it creates incentives to work hard, get an education, save, invest, and undertake risk. However, to the extent that opportunity itself is enhanced by access to economic resources, inequality of outcomes can exacerbate inequality of opportunity, thereby perpetuating a trend of increasing inequality. Such a link is suggested by the “Great Gatsby Curve,” the finding that, among advanced economies, greater income inequality is associated with diminished intergenerational mobility.3 In such circumstances, society faces difficult questions of how best to fairly and justly promote equal opportunity. My purpose today is not to provide answers to these contentious questions, but rather to provide a factual basis for further discussion. I am pleased that this conference will focus on equality of economic opportunity and on ways to better promote it. In my remarks, I will review trends in income and wealth inequality over the past several decades, then identify and discuss four sources of economic opportunity in America–think of them as “building blocks” for the gains in income and wealth that most Americans hope are within reach of those who strive for them. The first two are widely recognized as important sources of opportunity: resources available for children and affordable higher education. The second two may come as more of a surprise: business ownership and inheritances. Like most sources of wealth, family ownership of businesses and inheritances are concentrated among households at the top of the distribution. But both of these are less concentrated and more broadly distributed than other forms of wealth, and there is some basis for thinking that they may also play a role in providing economic opportunities to a considerable number of families below the top. In focusing on these four building blocks, I do not mean to suggest that they account for all economic opportunity, but I do believe they are all significant sources of opportunity for individuals and their families to improve their economic circumstances. Income and Wealth Inequality in the Survey of Consumer Finances While the recent trend of widening income and wealth inequality is clear, the implications for a particular family partly depend on whether that family’s living standards are rising or not as its relative position changes. There have been some times of relative prosperity when income has grown for most households but inequality widened because the gains were proportionally larger for those at the top; widening inequality might not be as great a concern if living standards improve for most families. That was the case for much of the 1990s, when real incomes were rising for most households. At other times, however, inequality has widened because income and wealth grew for those at the top and stagnated or fell for others. And at still other times, inequality has widened when incomes were falling for most households, but the declines toward the bottom were proportionally larger. Unfortunately, the past several decades of widening inequality has often involved stagnant or falling living standards for many families. Since the survey began in its current form in 1989, the SCF has shown a rise in the concentration of income in the top few percent of households, as shown in figure 1.6 By definition, of course, the share of all income held by the rest, the vast majority of households, has fallen by the same amount.7 This concentration was the result of income and living standards rising much more quickly for those at the top. After adjusting for inflation, the average income of the top 5 percent of households grew by 38 percent from 1989 to 2013, as we can see in figure 2. By comparison, the average real income of the other 95 percent of households grew less than 10 percent. Income inequality narrowed slightly during the Great Recession, as income fell more for the top than for others, but resumed widening in the recovery, and by 2013 it had nearly returned to the pre-recession peak.8 The distribution of wealth is even more unequal than that of income, and the SCF shows that wealth inequality has increased more than income inequality since 1989. As shown in figure 3, the wealthiest 5 percent of American households held 54 percent of all wealth reported in the 1989 survey. Their share rose to 61 percent in 2010 and reached 63 percent in 2013. By contrast, the rest of those in the top half of the wealth distribution–families that in 2013 had a net worth between $81,000 and $1.9 million–held 43 percent of wealth in 1989 and only 36 percent in 2013. The lower half of households by wealth held just 3 percent of wealth in 1989 and only 1 percent in 2013. To put that in perspective, figure 4 shows that the average net worth of the lower half of the distribution, representing 62 million households, was $11,000 in 2013.9 About one-fourth of these families reported zero wealth or negative net worth, and a significant fraction of those said they were “underwater” on their home mortgages, owing more than the value of the home.10 This $11,000 average is 50 percent lower than the average wealth of the lower half of families in 1989, adjusted for inflation. Average real wealth rose gradually for these families for most of those years, then dropped sharply after 2007. Figure 5 shows that average wealth also grew steadily for the “next 45″ percent of households before the crisis but didn’t fall nearly as much afterward. Those next 45 households saw their wealth, measured in 2013 dollars, grow from an average of $323,000 in 1989 to $516,000 in 2007 and then fall to $424,000 in 2013, a net gain of about one-third over 24 years. Meanwhile, the average real wealth of families in the top 5 percent has nearly doubled, on net–from $3.6 million in 1989 to $6.8 million in 2013. Housing wealth–the net equity held by households, consisting of the value of their homes minus their mortgage debt–is the most important source of wealth for all but those at the very top.11 It accounted for three-fifths of wealth in 2013 for the lower half of families and two-fifths of wealth for the next 45. But housing wealth was only one-fifth of total wealth for the top 5 percent of families. The share of housing in total net worth for all three groups has not changed much since 1989. Since housing accounts for a larger share of wealth for those in the bottom half of the wealth distribution, their overall wealth is affected more by changes in home prices. Furthermore, homeowners in the bottom half have been more highly leveraged on their homes, amplifying this difference. As a result, while the SCF shows that all three groups saw proportionally similar increases and subsequent declines in home prices from 1989 to 2013, the effects on net worth were greater for those in the bottom half of households by wealth. Foreclosures and the dramatic fall in house prices affected many of these families severely, pushing them well down the wealth distribution. Figure 6 shows that homeowners in the bottom half of households by wealth reported 61 percent less home equity in 2013 than in 2007. The next 45 reported a 29 percent loss of housing wealth, and the top 5 lost 20 percent. Fortunately, rebounding housing prices in 2013 and 2014 have restored a good deal of the loss in housing wealth, with the largest gains for those toward the bottom. Based on rising home prices alone and not counting possible changes in mortgage debt or other factors, Federal Reserve staff estimate that between 2013 and mid-2014, average home equity rose 49 percent for the lowest half of families by wealth that own homes.12 The estimated gains are somewhat less for those with greater wealth.13 Homeowners in the bottom 50, which had an average overall net worth of $25,000 in 2013, would have seen their net worth increase to an average of $33,000 due solely to home price gains since 2013, a 32 percent increase. Another major source of wealth for many families is financial assets, including stocks, bonds, mutual funds, and private pensions.14 Figure 7 shows that the wealthiest 5 percent of households held nearly two-thirds of all such assets in 2013, the next 45 percent of families held about one-third, and the bottom half of households, just 2 percent. This figure may look familiar, since the distribution of financial wealth has concentrated at the top since 1989 at rates similar to those for overall wealth, which we saw in figure 3.15 Those are the basics on wealth and income inequality from the SCF. Other research tells us that inequality tends to persist from one generation to the next. For example, one study that divides households by income found that 4 in 10 children raised in families in the lowest-income fifth of households remain in that quintile as adults.16 Fewer than 1 in 10 children of families at the bottom later reach the top quintile. The story is flipped for children raised in the highest-income households: When they grow up, 4 in 10 stay at the top and fewer than 1 in 10 fall to the bottom. Research also indicates that economic mobility in the United States has not changed much in the last several decades; that mobility is lower in the United States than in most other advanced countries; and, as I noted earlier, that economic mobility and income inequality among advanced countries are negatively correlated.17 Four Building Blocks of Opportunity Two of those are so significant that you might call them “cornerstones” of opportunity, and you will not be surprised to hear that both are largely related to education. The first of these cornerstones I would describe more fully as “resources available to children in their most formative years.” The second is higher education that students and their families can afford. Two additional sources of opportunity are evident in the SCF. They affect fewer families than the two cornerstones I have just identified, but enough families and to a sufficient extent that I believe they are also important sources of economic opportunity. The third building block of opportunity, as shown by the SCF, is ownership of a private business.18 This usually means ownership and sometimes direct management of a family business. The fourth source of opportunity is inherited wealth. As one would expect, inheritances are concentrated among the wealthiest families, but the SCF indicates they may also play an important role in the opportunities available to others. Resources Available for Children According to the SCF, the gap in wealth between families with children at the bottom and the top of the distribution has been growing steadily over the past 24 years, but that pace has accelerated recently. Figure 8 shows that the median wealth for families with children in the lower half of the wealth distribution fell from $13,000 in 2007 to $8,000 in 2013, after adjusting for inflation, a loss of 40 percent.21 These wealth levels look small alongside the much higher wealth of the next 45 percent of households with children. But these families also saw their median wealth fall dramatically–by one-third in real terms–from $344,000 in 2007 to $229,000 in 2013. The top 5 percent of families with children saw their median wealth fall only 9 percent, from $3.5 million in 2007 to $3.2 million in 2013, after inflation. For families below the top, public funding plays an important role in providing resources to children that influence future levels of income and wealth. Such funding has the potential to help equalize these resources and the opportunities they confer. Social safety-net spending is an important form of public funding that helps offset disparities in family resources for children. Spending for income security programs since 1989 and until recently was fairly stable, ranging between 1.2 and 1.7 percent of gross domestic product (GDP), with higher levels in this range related to recessions. However, such spending rose to 2.4 percent of GDP in 2009 and 3 percent in 2010.22 Researchers estimate that the increase in the poverty rate because of the recession would have been much larger without the effects of income security programs.23 Public funding of education is another way that governments can help offset the advantages some households have in resources available for children. One of the most consequential examples is early childhood education. Research shows that children from lower-income households who get good-quality pre-Kindergarten education are more likely to graduate from high school and attend college as well as hold a job and have higher earnings, and they are less likely to be incarcerated or receive public assistance.24 Figure 9 shows that access to quality early childhood education has improved since the 1990s, but it remains limited–41 percent of children were enrolled in state or federally supported programs in 2013. Gains in enrollment have stalled since 2010, as has growth in funding, in both cases because of budget cuts related to the Great Recession. These cuts have reduced per-pupil spending in state-funded programs by 12 percent after inflation, and access to such programs, most of which are limited to lower-income families, varies considerably from state to state and within states, since local funding is often important.25 In 2010, the United States ranked 28th out of 38 advanced countries in the share of four-year-olds enrolled in public or private early childhood education.26 Similarly, the quality and the funding levels of public education at the primary and secondary levels vary widely, and this unevenness limits public education’s equalizing effect. The United States is one of the few advanced economies in which public education spending is often lower for students in lower-income households than for students in higher-income households.27 Some countries strive for more or less equal funding, and others actually require higher funding in schools serving students from lower-income families, expressly for the purpose of reducing inequality in resources for children. A major reason the United States is different is that we are one of the few advanced nations that funds primary and secondary public education mainly through subnational taxation. Half of U.S. public school funding comes from local property taxes, a much higher share than in other advanced countries, and thus the inequalities in housing wealth and income I have described enhance the ability of more-affluent school districts to spend more on public schools. Some states have acted to equalize spending to some extent in recent years, but there is still significant variation among and within states. Even after adjusting for regional differences in costs and student needs, there is wide variation in public school funding in the United States.28 Spending is not the only determinant of outcomes in public education. Research shows that higher-quality teachers raise the educational attainment and the future earnings of students.29 Better-quality teachers can help equalize some of the disadvantages in opportunity faced by students from lower-income households, but here, too, there are forces that work against raising teacher quality for these students. Research shows that, for a variety of reasons, including inequality in teacher pay, the best teachers tend to migrate to and concentrate in schools in higher-income areas.30 Even within districts and in individual schools, where teacher pay is often uniform based on experience, factors beyond pay tend to lead more experienced and better-performing teachers to migrate to schools and to classrooms with more-advantaged students.31 Higher Education that Families Can Afford Along with other data, the SCF shows that most students and their families are having a harder time affording college. College costs have risen much faster than income for the large majority of households since 2001 and have become especially burdensome for households in the bottom half of the earnings distribution. Rising college costs, the greater numbers of students pursuing higher education, and the recent trends in income and wealth have led to a dramatic increase in student loan debt. Outstanding student loan debt quadrupled from $260 billion in 2004 to $1.1 trillion this year. Sorting families by wealth, the SCF shows that the relative burden of education debt has long been higher for families with lower net worth, and that this disparity has grown much wider in the past couple decades. Figure 10 shows that from 1995 to 2013, outstanding education debt grew from 26 percent of average yearly income for the lower half of households to 58 percent of income.34 The education debt burden was lower and grew a little less sharply for the next 45 percent of families and was much lower and grew not at all for the top 5 percent.35 Higher education has been and remains a potent source of economic opportunity in America, but I fear the large and growing burden of paying for it may make it harder for many young people to take advantage of the opportunity higher education offers. Opportunities to Build Wealth through Business Ownership While business wealth is highly concentrated at the top of the distribution, it also represents a significant component of wealth for some other households.36 Figure 11 shows that slightly more than half of the top 5 percent of households have a share in a private business. The average value of these holdings is nearly $4 million. Only 14 percent of families in the next 45 have ownership in a private business, but for those that do, this type of wealth constitutes a substantial portion of their assets–the average amount of this business equity is nearly $200,000, representing more than one-third of their net worth. Only 3 percent of the bottom half of households hold equity in a private business, but it is a big share of wealth for those few.37 The average amount of this wealth is close to $20,000, 60 percent of the average net worth for these households.38 Owning a business is risky, and most new businesses close within a few years. But research shows that business ownership is associated with higher levels of economic mobility.39 However, it appears that it has become harder to start and build businesses. The pace of new business creation has gradually declined over the past couple of decades, and the number of new firms declined sharply from 2006 through 2009.40 The latest SCF shows that the percentage of the next 45 that own a business has fallen to a 25-year low, and equity in those businesses, adjusted for inflation, is at its lowest point since the mid-1990s. One reason to be concerned about the apparent decline in new business formation is that it may serve to depress the pace of productivity, real wage growth, and employment.41 Another reason is that a slowdown in business formation may threaten what I believe likely has been a significant source of economic opportunity for many families below the very top in income and wealth. Inheritances Figure 12 shows that half of the top 5 percent of households by wealth reported receiving an inheritance at some time, but a considerable number of others did as well–almost 30 percent of the next 45 percent and 12 percent of the bottom 50. Inheritances are concentrated at the top of the wealth distribution but less so than total wealth. Just over half of the total value of inheritances went to the top 5 percent and 40 percent went to households in the next 45. Seven percent of inheritances were shared among households in the bottom 50 percent, a group that together held only 1 percent of all wealth in 2013.43 The average inheritance reported by those in the top 5 percent who had received them was $1.1 million. That amount dwarfs the $183,000 average among the next 45 percent and the $68,000 reported among the bottom half of households. But compared with the typical wealth of these households, the additive effect of bequests of this size is significant for the millions of households below the top 5 that receive them. The average age for receiving an inheritance is 40, when many parents are trying to save for and secure the opportunities of higher education for their children, move up to a larger home or one in a better neighborhood, launch a business, switch careers, or perhaps relocate to seek more opportunity. Considering the overall picture of limited resources for most families that I have described today, I think the effects of inheritances for the sizable minority below the top that receive one are likely a significant source of economic opportunity. Conclusion
Other Formats 454 KB PDF1. See Salvatore Morelli, Timothy Smeeding, and Jeffrey Thompson (2014), “Post-1970 Trends in Within-Country Inequality and Poverty: Rich and Middle Income Countries (PDF) 2. For income inequality in the past 100 years, see Anthony B. Atkinson, Thomas Piketty, and Emmanuel Saez (2011), “Top Incomes in the Long Run of History (PDF) 3. See Alan B. Krueger (2012), “The Rise and Consequences of Inequality in the United States (PDF),” speech delivered at the Center for American Progress, Washington, January 12. Return to text 4. Asset questions in the SCF are based on the value at the time of the survey. Since most interviews were completed between April and December 2013, some of the asset values do not reflect price increases experienced in late 2013, and none reflect increases in 2014. Income questions in the SCF refer to the prior calendar year, so the 2013 survey reports 2012 income. See Jesse Bricker, Lisa J. Dettling, Alice Henriques, Joanne W. Hsu, Kevin B. Moore, John Sabelhaus, Jeffrey Thompson, and Richard A. Windle (2014), “Changes in U.S. Family Finances from 2010 to 2013: Evidence from the Survey of Consumer Finances,” Federal Reserve Bulletin, vol. 100 (September), pp. 1-41. Return to text 5. “Households” and “families” are used interchangeably in these remarks because the SCF uses both interchangeably to describe its respondents. Return to text 6. The share of income that went to the top 5 percent of households–a threshold of $230,000 in gross income in 2013–rose from 31 percent of income reported by all respondents in 1989 to 37 percent in 2007. The income share for this group fell in the financial crisis, to 34 percent in 2010, then rose in the recovery, regaining a 37 percent share in 2013. Return to text 7. The top half of the distribution, except for the top 5 percent, earned 53 percent of all income in 1989 but only 51 percent in 2010. In 2013, households in the “next 45 percent” had incomes between $47,000 and $230,000. While income has rebounded for the top 5 percent in the recovery, the share that went to the next 45 percent declined further to 49 percent in 2013. The bottom half of the distribution saw their share of income fall from 16 percent in 1989 to 15 percent in 2007, edge up in 2010, and then reach a new low for the survey last year at 14 percent. Return to text 8. Largely because of losses in income from financial holdings, the share of total income received by the top 5 percent of households fell 3 percentage points from 2007 to 2010, with the next 45 percent and lower half of households each gaining about half of that share. Some of the nominal income losses for households below the top 5 percent were offset by larger-than-normal transfer payments during the recession. Return to text 9. All SCF income and wealth data prior to the 2013 survey are adjusted for inflation by expressing the values in 2013 dollars. Return to text 10. In the 2013 SCF, 17 percent of all families reporting zero or negative net worth also reported they were underwater on their home mortgages. Return to text 11. Housing wealth includes the net equity in primary residences and other residential real estate. Return to text 12. The house price data used are from CoreLogic, and data track price changes at the Core Based Statistical Area level between the survey month in 2013 and June 2014. The average increase in home prices over this period was 8 percent. No adjustments are made to account for possible changes in mortgage leverage. Return to text 13. Home price gains in 2013 and 2014 are estimated to have raised the home equity of home-owning households in the next 45 percent of households in the wealth distribution by 12 percent, and by 9 percent for home-owning households in the top 5 percent of the wealth distribution. Return to text 14. The SCF defines financial assets as liquid assets, certificates of deposit, directly held pooled investment funds, stocks, bonds, quasi-liquid assets (including retirement accounts), savings bonds, whole life insurance, other managed assets, and other financial assets. Return to text 15. In 1989, the top 5 percent of households held 54 percent of financial assets, the next 45 percent (that is, home-owning households in the 50th through 95th percentiles of the wealth distribution) held 42 percent, and the bottom half held 4 percent. Return to text 16. See Pew Charitable Trusts (2012), Pursuing the American Dream: Economic Mobility across Generations (PDF) 17. See Raj Chetty, Nathaniel Hendren, Patrick Kline, Emmanuel Saez, and Nicholas Turner (2014), “Is the United States Still a Land of Opportunity? Recent Trends in Intergenerational Mobility 18. Business assets in the SCF include both actively and “non-actively” managed businesses but do not include ownership of publicly traded stock. Return to text 19. See, for example, Janet Currie and Douglas Almond (2011), “Human Capital Development before Age Five,” ch. 15 in David Card and Orley Ashenfelter, eds., Handbook of Labor Economics, vol. 4 (Holland: Elsevier), pp. 1315-1486. Return to text 20. Homeownership by parents is strongly associated with economic success for children; see Thomas P. Boehm and Alan M. Schlottmann (1999), “Does Home Ownership by Parents Have an Economic Impact on Their Children? 21. Distributional statistics for families with children are based on a sorting of only families with children. Return to text 22. Congressional Budget Office historic budget data. Income security programs include UI, SSI, SNAP EITC, and other family support and nutrition programs. Return to text 23. See Jeffrey P. Thompson and Timothy M. Smeeding (2013), “Inequality and Poverty in the United States: The Aftermath of the Great Recession (PDF),” Finance and Economics Discussion Series 2013-51 (Washington: Board of Governors of the Federal Reserve System, July). Return to text 24. See James J. Heckman, Seong Hyeok Moon, Rodrigo Pinto, Peter A. Savelyev, and Adam Yavitz (2010), “The Rate of Return to the HighScope Perry Preschool Program,” Journal of Public Economics, vol. 94 (1-2), pp. 114-28; and Clive R. Belfield, Milagros Nores, Steve Barnett, and Lawrence Schweinhart (2006), “The High/Scope Perry Preschool Program: Cost-Benefit Analysis Using Data from the Age-40 Followup,” Journal of Human Resources, vol. 41 (Winter), pp. 162-90. Return to text 25. The share of four-year-olds in state-funded pre-K programs increased from 14 percent in 2002 to 27 percent in 2010 but has been 28 percent since. Head Start enrollments have been fairly steady since 2005. Forty-one percent of four-year-olds were enrolled in federally funded Head Start or state-funded pre-K education programs in 2013. See National Institute for Early Education Research (2013), The State of Preschool 2013: State Preschool Yearbook (PDF) 26. See Organisation for Economic Co-operation and Development (2013), “How Do Early Childhood Education and Care (ECEC) Policies, Systems and Quality Vary across OECD Countries? (PDF) 27. See Organisation for Economic Co-operation and Development (2013), Education at a Glance 2013: OECD Indicators (PDF) 28. See Education Week (2014), Quality Counts 2014: District Disruption and Revival 29. See Eric A. Hanushek (2011), “The Economic Value of Higher Teacher Quality,” Economics of Education Review, vol. 30 (June), pp. 466-79; or, for estimates of the future earnings students gain by having a better teacher, see Raj Chetty, John N. Friedman, and Jonah E. Rockoff, “The Long-Term Impacts of Teachers: Teacher Value-Added and Student Outcomes in Adulthood,” 30. See Eric Isenberg, Jeffrey Max, Philip Gleason, Liz Potamites, Robert Santillano, Heinrich Hock, and Michael Hansen (2013), Access to Effective Teaching for Disadvantaged Students (PDF) 31. Better and more-experienced teachers tend to move to better-resourced schools, including those with more active outside funding, or those with more-advantaged students, such as magnet schools. Even within schools, more experienced and higher performing teachers are more likely to teach Advanced Placement classes which tend to serve more advantaged students. The result is that lower income and lower achieving students are more likely to be taught by less experienced and lower performing teachers. See Charles Clotfelter, Helen Ladd, Jacob Vigdor, and Justin Wheeler (2007), “High Poverty Schools and the Distribution of Teachers and Principals,” North Carolina Law Review, vol. 85 (2), pp. 1345-79; Charles Clotfelter, Helen Ladd, and Jacob Vigdor (2005), “Who Teaches Whom? Race and the Distribution of Novice Teachers,” Economics of Education Review, vol. 24 (August), pp. 377-92; and Hamilton Lankford, Susanna Loeb, and James Wyckoff (2002), “Teacher Sorting and the Plight of Urban Schools: A Descriptive Analysis,” Education Evaluation and Policy Analysis, vol. 37 (Spring), pp. 37-62. Return to text 32. See Sandy Baum (2014), Higher Education Earnings Premium: Value, Variation, and Trends (PDF) 33. Taking into account the cost of paying for education and years spent in college and not working, economists at the Federal Reserve Bank of New York estimate that the lifetime return to a college degree is 15 percent. See Jaison R. Abel and Richard Deitz (2014), “Do the Benefits of College Still Outweigh the Costs? (PDF)” 34. Education debt in the SCF reflects the total amount of debt outstanding at the time of the survey. Return to text 35. Education debt-to-income ratio is calculated based on what SCF respondents reported as their usual income. Numbers are for families with education debt. Return to text 36. The SCF does not ask households whether they started businesses that closed, so reported business ownership and wealth is largely related only to those businesses that succeed. Return to text 37. Distributional statistics for business ownership and assets exclude outliers with large negative net worth. Return to text 38. Business wealth took a big hit due to the recession and has only partly recovered for most families. For the bottom half of the distribution, the $20,000 average in business wealth in 2013 was down from $29,000, after adjusting for inflation, in 2007. The nearly $200,000 held by the next 45 percent with businesses was down from $228,000 in 2007. The $4 million in business wealth of the top 5 percent in 2013 was down, in real terms, from $4.4 million in 2007. Return to text 39. See, for example, Robert Fairlie (2004), “Earnings Growth among Young Less-Educated Business Owners,” Industrial Relations, vol. 43 (July), pp. 634-59; Douglas Holtz-Eakin, Harvey S. Rosen, and Robert Weathers (2000), “Horatio Alger Meets the Mobility Tables,” Small Business Economics, vol. 14, pp. 243-74; and Vincenzo Quadrini (2000), “Entrepreneurship, Saving, and Social Mobility,” Review of Economic Dynamics, vol. 3 (January), pp. 1-40. Return to text 40. See Business Dynamics Statistics, U.S. Census Bureau. For analysis documenting the decline in new and young firms, see John Haltiwanger, Ron Jarmin, and Javier Miranda (2012), Where Have All the Young Firms Gone? (PDF) 41. See Steven J. Davis and John Haltiwanger (2014), “Labor Market Fluidity and Economic Performance (PDF),” 42. This topic is discussed extensively in Thomas Piketty (2014), Capital in the 21st Century, trans. Arthur Goldhammer (Cambridge, Mass.: Belknap Press). Return to text 43. Reported inheritances can have been received at any point in the respondent’s life. As with other forms of wealth cited in these remarks, inheritances have been adjusted for inflation and are expressed in 2013 dollars. Return to text |
| Posted: 25 Oct 2014 05:00 PM PDT Trailer 1 ~~~ Trailer 2 |
| Posted: 25 Oct 2014 12:00 PM PDT 1. Ideas are a dime a dozen, execution is everything. 2. We do not live in a pitch economy, almost no one is buying ideas, they’re buying companies, they’re buying something active that is generating capital. 3. We’re all Missourians today, that’s right, we all live in the SHOW ME state. We want to see evidence of your success, of the implementation of your idea, we don’t just want to hear you talk about it. 4. Ideas are in the air. Many people are working on similar breakthroughs at the same time. While you believe your idea is unique, there’s a good chance someone else is aware of it and is trying to achieve the same goal and is working while you sleep. 5. Talk is cheap. That’s why it’s so hard to get someone of power to converse, never mind go to a meal. A professional can tell in just a few sentences whether you’re real. Furthermore, if you create something real these same professionals will be breathing down your neck. 6. Success is hard work and very few want to do the heavy lifting. Because it’s boring, because it’s challenging, because no one is paying attention, because it might not pay off in the long run anyway. 7. Too many people want others to do the work. They revel in their seats as they pontificate about the great things that can be achieved with their ideas. Why don’t they just make the effort themselves? Because they don’t have the desire. That’s the secret of life, we all follow our desires, our passions, and a mediocre idea with incredible follow-through by someone who cares about it trumps a great idea with lame execution every day of the week. 8. In the tech economy everyone believes it’s about the idea. But so many of the successful companies were not innovators so much as combiners of previous technologies with a bit of vision and great execution. Google didn’t invent search and Facebook didn’t invent social networking and Apple didn’t invent the portable music player. In each case someone else had the initial idea. But Google took someone else’s idea and employed algorithms to deliver the search results you always wanted but had previously been unable to find. Facebook regulated the marketplace, they created a social home that worked on all media, and found a way to eat Google’s lunch by figuring out advertising on mobile. That’s right, Facebook survives on advertising, they didn’t invent that model, they just refined it. And Apple bought SoundJam to build iTunes and threw FireWire into the pot to create the iPod. So don’t keep thinking about coming up with something out of thin air, but utilizing the already extant 9. It’s easier to tell someone what to do than to do it yourself. 10. If you want something done right, do it yourself, because rarely does anybody care about it as much as you do. 11. What looks like a bad idea to some is a winner in the hands of another. 12. Opportunities are abundant, but most people are afraid to do the work. 13. If someone is telling you what you could do, you’re probably best off ignoring them, because you know better what you should do, and will put in the effort to make it a success. 14. What separates winners from losers is whether they’re willing to get their hands dirty. Behind every overnight success is a ton of unseen work. 15. It’s easy to judge, it’s much harder to do. But don’t think your efforts are sans judgments, because someone always has to buy to make you successful, whether it be an intermediary or the public. So if your product/service/music has no traction, there’s judgment right there, it’s not commercial. Too many people blame someone else for their failures when they should really be blaming themselves. 16. Don’t waste people’s time with unimportant details, what is important to you may not be important to them. An expert knows what has potential. Your pet project is irrelevant to them if they can’t make money with it. Respect others’ time and knowledge. 17. Many people don’t follow through because they don’t want to, not because they’re incompetent. While you’re busy lamenting you didn’t get a return phone call or e-mail, frequently that person is not tanning at the beach but expending effort on what will help him out and make him happy. Want to motivate someone? Think about delivering what they want. ~~~ –
|
| Posted: 25 Oct 2014 07:00 AM PDT This week's Masters in Business Radio show at 10:00 am and 6:00 pm on Bloomberg Radio 1130AM and Siriux XM 119 (it also repeats all weekend). Our guest this week is Paul Krugman, Nobel laureate, Princeton professor of economics and New York Times columnist and blogger. You can listen to the show live here. Shortly after the show, you can stream it at Soundcloud or download the one hour, 20 minute podcast here or on iTunes. Yes, all of the prior Podcasts are finally on Apple iTunes. Next week, we speak with Ralph Acampora, founder of the Market Technician’s Association. |
| Posted: 25 Oct 2014 05:30 AM PDT Welcome to the weekend. Pull up an easy chair, tall yourself a hot cup of joe, and enjoy our longer form weekend reads:
What is going on for the weekend?
America is Becoming Less Religious
|
| Posted: 25 Oct 2014 03:30 AM PDT Reuters reports that the ECB is considering buying corporate bonds as early as Q1 (January) next year, with the decision to be taken in December. Mr Draghi has admitted that the only real option left for the ECB is to increase the size of its balance sheet and such a move makes sense. No doubt, the Bundesbank and German politicians will oppose such a policy, though without this and/or similar actions, the economic climate in the Eurozone (EZ) is set to worsen materially. Mr Weidmann of the Bundesbank states that the risk of deflation in the EZ remains low, which I have to say is optimistic. To date Draghi has succeeded in increasing monetary accommodation, despite the opposition of the Bundesbank and I expect he will continue to do so. However, a January start date seems optimistic in my view, as the ECB will want to assess the impact of its other programmes which have just started. The move will be Euro negative, though clearly positive for EZ equity and corporate bond markets. Mr Draghi will be quizzed on this matter at the next ECB meeting in November. Whilst France once again disappointed, I must admit that the preliminary October EZ PMI reading came in better than I had expected, in particular for Germany. However, the more forward looking components suggests that the region is "teetering on the verge of another downturn", according to Markit, the producers of the index. Businesses are reducing prices and employment levels to cut costs and boost sales. Chinese Q3 GDP came in at +7.3%, despite a significant rise in fiscal and monetary stimulus. That’s the dilemma facing the Chinese authorities, who clearly want to avoid a further stimulus programme, though they will "encourage" the Central Bank, the PBoC to provide monetary stimulus. There is growing evidence of portfolio outflows out of the EZ and into the US/US$. With negative yields in the EZ and particularly low inflation, the Euro is increasingly being used as a funding currency for carry trades. Furthermore, Central Banks globally appear to be reducing their Euro holdings. I remain particularly bearish on the Euro and EZ markets and favour the US$ and US markets. The UK remains the best economy in Europe, though the FTSE 100 is heavily weighted in the energy and mining sector, which will adversely impact the index, if, as I believe, commodity prices remain weak. However, I continue to believe that the Bank of England will be the 1st major central bank to raise rates and, as a result, believe that Sterling will appreciate, in particular against the Euro. US Existing home sales rose by +2.4% to an annual rate of 5.17mn homes in September, above the forecast for an annual rate of 5.1mn homes and the highest rate in 1 year. New home sales came in at an annualised rate of 467k, as compared with the forecast of 470k and Augusts downwardly revised annual rate of 466k. US September CPI rose by +1.7% Y/Y (+0.1% M/M), slightly higher than the rate of +1.6% expected. Core CPI came in at +1.7% Y/Y, in line with expectations. Food and housing cost increases offset lower energy prices. Jobless claims (4 week moving average) declined to 281k, down from 284k and the lowest for 14 years. The index of leading indicators rose by +0.8% in September M/M, as opposed to the unchanged level in August and better than the rise of +0.7% expected. 9 out of the 10 indicators were positive. EU EZ government debt to GDP rose to 92.7% in Q2 2014, up from 91.9% in Q1. Surprisingly, the EZ October manufacturing PMI came in at 50.7, above September's 50.3 and the forecast of 49.9. Services PMI came in at an unchanged 52.4, as opposed to 52.0 expected. German October preliminary manufacturing PMI came in at 51.8, much better than the 49.5 expected and 49.9 in September. Services PMI came in at 54.8, as opposed to 55.0 expected and Septembers 55.7. As usual, France disappointed, with manufacturing PMI coming in at 47.3, worse than the 48.5 expected and 48.8 in September. Services came in at 48.1, slightly lower than the 48.3 expected and 48.4 in September. The Bank of Spain forecasts +0.5% GDP growth for Q3, slightly lower than the rate of +0.6% in Q2. However, the Bank of Italy (BoI) states that GDP likely contracted slightly in Q3. It added, that the outlook for exports was uncertain and that household and business confidence was weak. Furthermore, the BoI believes that there will be a prolonged period of low inflation, which will increase the risks associated with a rise in debt to GDP, which was 133.8% at the end of Q2. Italian retail sales came in at -3.1%Y/Y in August much worse than the decline of -1.7% in August. Bloomberg reports that 25 banks will fail the regulators Comprehensive Assessment. 105 banks are set to pass. 10 of the banks that failed have capital shortfalls. The results will be announced tomorrow. The UK's budget deficit rose in the 6 months to 30th September to £58bn, as compared with £52.6bn a year earlier. The government in March of this year forecast that the deficit would decline by £12bn in the fiscal year ending 31st March 2015 – the data suggests that it will rise. Minutes of the Bank of England’s (BoE) meeting on 7/8th October revealed that 2 of the 9 members voted to raise rates, as was expected. Members were increasingly concerned about the slowing global economy and, in particular the "loss of momentum in the euro area", which will impact the UK economy. Furthermore, members expected weak price pressures and low wage growth. A particularly dovish report, which resulted in sterling declining. The market is pricing in a rate hike in Q3 2015, though I continue to believe that rates will be raised in Q1 2015. Annual wages and salaries reviews in this Q should result in a rise in January, which I believe will be greater than currently predicted. UK retail sales declined by -0.3% in September M/M, worse than the decline of -0.1% expected and August's rise of +0.4%. It was the weakest since January. UK Q3 GDP rose by +0.7% Q/Q,(+2.8% on an annualised basis) in line with expectations, though below the rise of +0.9% in Q2. Growth in the important service sector slowed to +0.5%, down from +1.0% in Q2, whilst business services growth eased to +1.0%, down from +1.5%. Manufacturing increased by +0.4%, the slowest rate of growth since Q1 2013. The UK economy has grown by +3.4% since the pre-recession peak in Q1 2008. Japan The Japanese government has lowered its economic assessment for the 2nd consecutive month. It cut its output assessment, together with its view on private consumption. Japanese exports rose by +6.9% in September Y/Y, higher than the rise of +6.5% expected and the most in 7 months. Imports rose by +6.2%, far higher than the rise of +2.7% expected. The trade deficit came in at Yen 958.3bn, higher than the Yen 780 bn deficit expected, though better than August's deficit of Yen 949.7bn. Lower energy and commodity prices should have reduced imports and the trade deficit, but the much higher than expected increase in imports suggests that the April's sales tax hike is finally having less of an impact. The Japanese government sold 3 month bills at a negative yield for the 1st time ever. However, investors who bought the debt will sell it to the BoJ at a profit !!!. Excluding the impact of the April's sales tax hike, the Bank of Japan states that there is a greater chance that inflation will fall below +1.0% in coming months. An increase in the size of its asset purchase programme looks more likely. The Yen weakened on the news. China The preliminary HSBC manufacturing PMI came in at 50.4, slightly higher than the 50.2 expected. However, output, orders and export orders increased at a slower rate, whilst input and output prices declined at a faster rate. PPI fell to -1.8% in September Y/Y, the 31st consecutive monthly decline. The Chinese finance minister announced that the central authorities would allow local governments to issue new debt to replace maturing debt. Clearly an exercise of can kicking. Chinese annual deposit growth has slowed to below 10%, a record low. The lower rate of deposit growth is forcing banks to raise very expensive money (around 16%) from the shadow banking market, which clearly will impact profitability at a time when non performing loans are rising. The FT reports that Chinese outbound direct investment this year is set to exceed inward investment for the 1st time ever. Chinese new home prices fell in 69 out of 70 cities in September M/M, up from 68 cities in August and the 5th consecutive monthly decline. The property sector continues to decline, with average prices down by -1.3% Y/Y, the 1st annual decline in almost 2 years. Other Australia's core inflation rose by +0.4% in Q3 Q/Q (+2.5% Y/Y), below the rise of +0.5% expected. The lower than expected inflation rate allows the Central Bank, the RBA to keep rates lower for longer. The Brazilian Real has fallen to its lowest level since 2008 in anticipation of Ms Rousseff winning in this weekends Presidential elections. The equity markets have also been weak. This weekends Parliamentary elections in the Ukraine should result in Mr Poroshenko's party, together with allies controlling Parliament. It that does happen, a deal with Russia and the West becomes much more likely. To date, the problem has been that Mr Poroshenko has not been able to get Parliamentary support to do a deal which will involve offering concessions to pro-Russian separatists. German sources report that Mrs Merkel, Mr Putin and Mr Poroshenko seek to do a deal on gas supplies on the 29th of this month, if Mr Poroshenko and his allies win. Kiron Sarkar |
 ,” IRP Discussion Paper Series 1419-14 (Madison, Wis.: Institute for Research on Poverty, March).
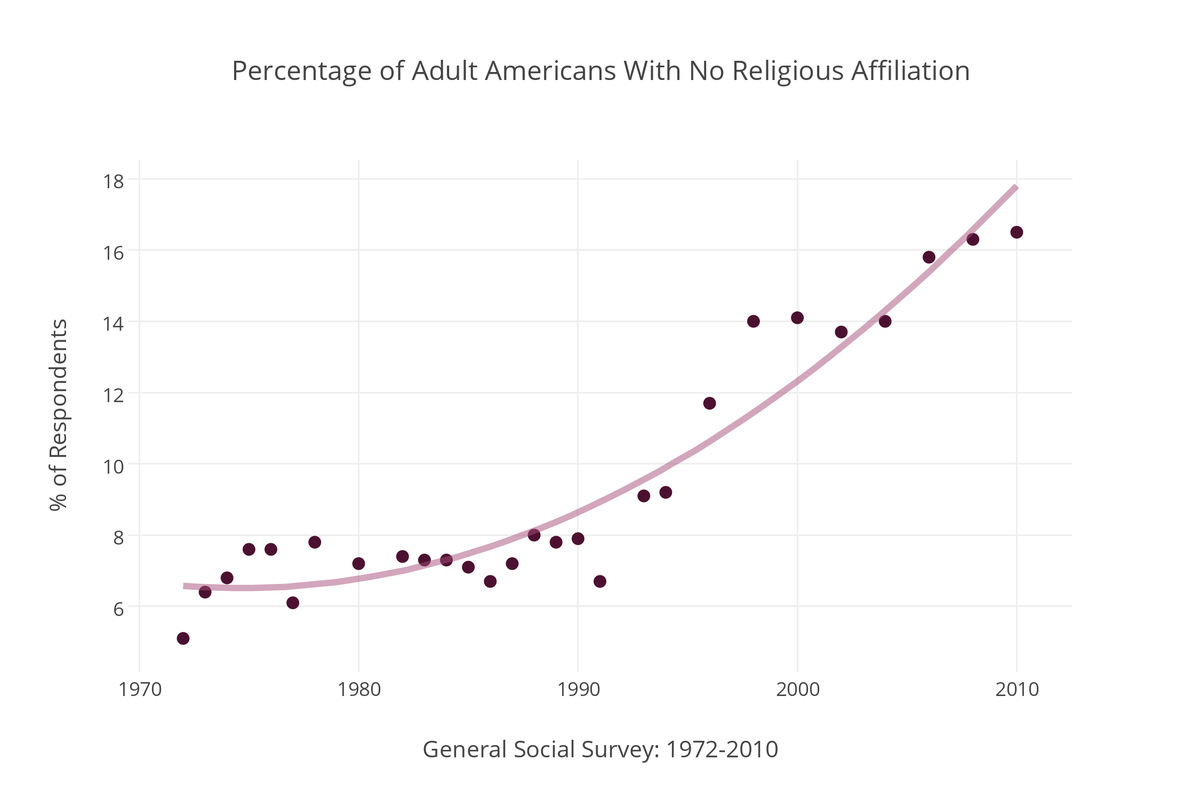
| You are subscribed to email updates from The Big Picture To stop receiving these emails, you may unsubscribe now. | Email delivery powered by Google |
| Google Inc., 1600 Amphitheatre Parkway, Mountain View, CA 94043, United States | |


0 comments:
Post a Comment