


The Big Picture |
- Big Banks and Other Corporate Bigwigs Benefit from Illegal Spying
- 10 Tuesday PM Reads
- Romancing Alpha, Forsaking Beta
- May Employment Report Offers Little Cause for Celebration
- 10 Tuesday AM Reads
- Look Out Below, Turkish Style
- Drilling Down into Core Inflation: Goods versus Services
- How Alternative Investments Are ‘Misperception’
| Big Banks and Other Corporate Bigwigs Benefit from Illegal Spying Posted: 11 Jun 2013 10:30 PM PDT Government Spying on Americans … and then Giving Info to Giant Corporations
You've heard that the government spies on all Americans. But you might not know that the government shares some of that information with big corporations. In addition, Reuters reported in 2011 that the NSA shares intelligence with Wall Street banks in the name of "battling hackers."
In March, PC Magazine noted:
CISPA would allow the NSA to more openly share data with corporations in the name of protecting against "cyber threats." But that phrase is too squisy. As the Electronic Frontier Foundation notes:
Moreover, as the ACLU notes, "Fusion Centers" – a hybrid of military, intelligence agency, police and private corporations set up in centers throughout the country, and run by the Department of Justice and Department of Homeland Security – allow big businesses like Boeing to get access to classified information which gives them an unfair advantage over smaller competitors:
A 2008 Department of Homeland Security Privacy Office review of fusion centers concluded that they presented risks to privacy because of ambiguous lines of authority, rules and oversight, the participation of the military and private sector, data mining, excessive secrecy, inaccurate or incomplete information and the dangers of mission creep. The Senate Permanent Subcommittee on Investigations found in 2012 that fusion centers spy on citizens, produce 'shoddy' work unrelated to terrorism or real threats:
Under the FBI's Infraguard program, businesses sometimes receive intel even before elected officials. Law enforcement agencies spy on protesters and then share the info – at taxpayer expense – with the giant Wall Street banks And a security expert says that all Occupy Wall Street protesters had their cellphone information logged by the government. Alternet notes:
In essence, big banks and giant corporations are seen as being part of "critical infrastructure" and "key resources" … so the government protects them. That creates a dynamic where the government will do quite a bit to protect the big boys against any real or imagined threats … whether from activists or even smaller competitors. (Remember that the government has completely propped up the big banks, even though they went bankrupt due to stupid gambles.) And given that some millions of private contractors have clearance to view information gathered by spy agencies, and that information gained by the NSA by spying on Americans is being shared with agencies in other countries, at least some of the confidential information is undoubtedly leaking into private hands even without the government's knowledge or consent. As the ACLU noted in 2004:
Indeed, the government has been affirmatively helping the big banks, giant oil companies and other large corporations cover up fraud and to go after critics. For example, Business Week reported on May 23, 2006:
Reuters noted in 2010:
Wired reported the same year:
In an effort to protect Bank of America from the threatened Wikileaks expose of wrongdoing – the Department of Justice told Bank of America to a hire a specific hardball-playing law firm to assemble a team to take down WikiLeaks (and see this) The government and big banks actually coordinated on the violent crackdown of the anti-big bank Occupy protest. The government is also using anti-terrorism laws to keep people from learning what pollutants are in their own community, in order to protect the fracking, coal and other polluting industries. See this, this, this, this and this. Investigating factory farming can get one labeled a terrorist. Infringing the copyright of a big corporation may also get labeled as a terrorist … and a swat team may be deployed to your house. See this, this, this and this. As the executive director of the Information Society Project at Yale Law School notes:
In short, the "national security" apparatus has been hijacked to serve the needs of big business |
| Posted: 11 Jun 2013 02:00 PM PDT My afternoon train reads:
What are you reading?
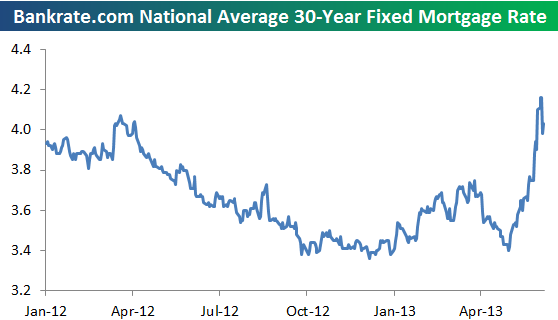
Spike in Mortgage Rates |
| Romancing Alpha, Forsaking Beta Posted: 11 Jun 2013 11:00 AM PDT Below is my presentation: The High Cost of Neuro-Financial Errors: How Cognitive Bias and Performance Chasing leads to Investing Failures at the Trustee Leadership Forum for Retirement Security conference at the Kennedy School, Harvard University June 10, 2013.
Cambridge is simply lovely . . . |
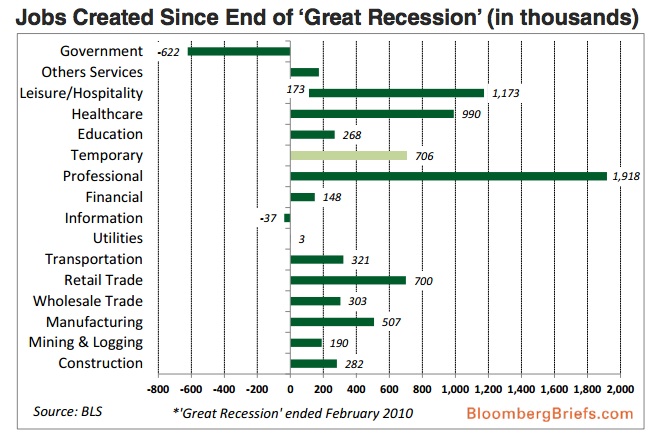
| May Employment Report Offers Little Cause for Celebration Posted: 11 Jun 2013 08:30 AM PDT Click to enlarge
Yammy:
Not especially encouraging . . . Its something I would very much like to see improve . . .
Source: |
| Posted: 11 Jun 2013 07:00 AM PDT My morning reads:
What are you reading?
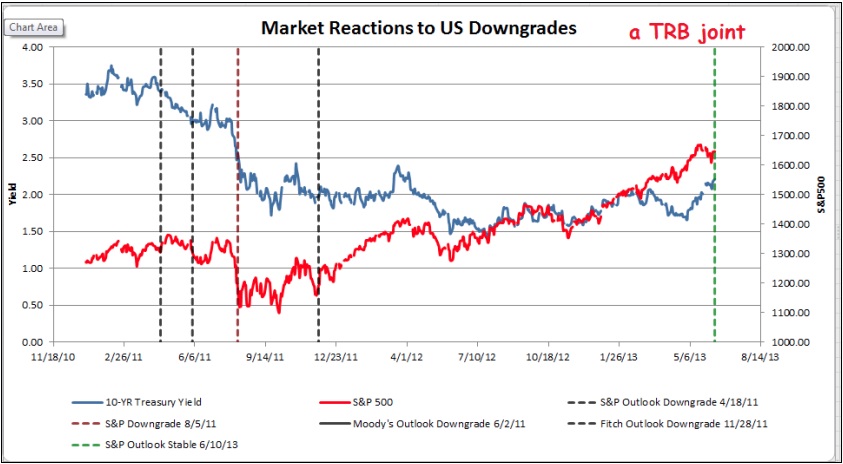
It's a good thing S&P isn't a hedge fund |
| Posted: 11 Jun 2013 04:18 AM PDT click for updated futures
Yes, that headline is a bit tongue in cheek. I doubt very much that the unrest in Turkey is a driver of equity prices globally. If you are looking for an after-the-fact rationalization as to why stocks are off about 1-2% worldwide, your culprit is more likely the Yen than anything else. It strengthened after Bank of Japan Governor Haruhiko Kuroda failed to discuss more stimulus, leading junkies everywhere to fear that their supply of that good shit was not going to find its way into their veins. No dopamine rush this morning, kids. Also worth noting: There are less than three weeks left in Q2, and pre-announcement season is upon us. Look for an uptick in negative warnings as the impact of the Sequester is felt. There are other signs of the ongoing slow recovery. The general economics data is mixed, with no imminent stall seen but no ignition of animal spirits either. (At least, outside of equity markets). Hence, with the focus on risk assets and speculation, the market moves seem to have an outsized mindshare of what’s covered in the media versus their relative size and import — versus what really matters — these days. Regardless, our context remains a market that has simply run too far too fast not to not be overdue for a pullback. Consider that 16% YTD to the peak in May (38.4% annualized) and 2.3% (w/divs) in with May (~27% annualized) is not what a 2% GDP typically produces (though there is minimal correlation most of the time between economics and equities). These are obviously unsustainable paces, and at the very least require some digestion. The tone of the market has changed, and the straight up silliness is likely put back in its box until next season. Anyone who is surprised by the backing & filling after the past 6 months hasn’t really paying attention. At this point, most traders (and even many investors) are trying to discern whether this is a mere refractory period or the end of the bull cycle. Its still too early to make either claim decisively. I find it to be helpful to hunt for various signs of confirmation or divergence in market internals, various sectors, and even classic Dow Theory plays out. There is enough meat in those areas that its worthy of its own post, coming some time in the near future.
|
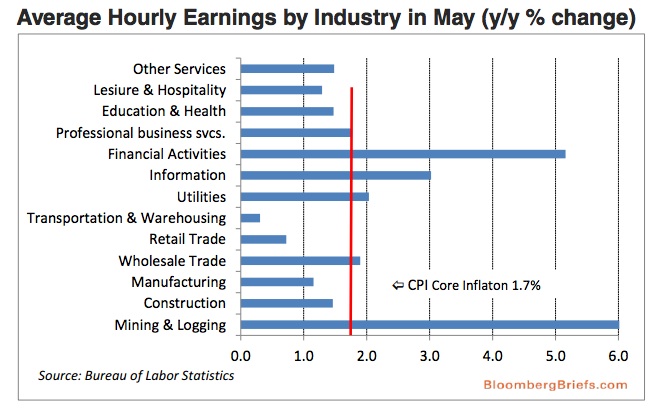
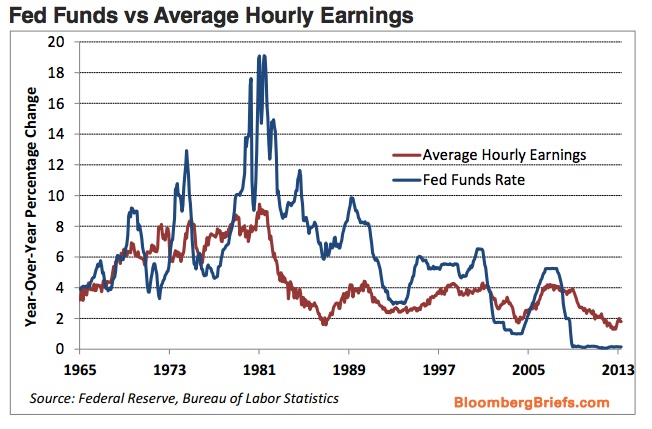
| Drilling Down into Core Inflation: Goods versus Services Posted: 11 Jun 2013 03:00 AM PDT Drilling Down into Core Inflation: Goods versus Services
Among the measures of core inflation used to monitor the inflation outlook, the series excluding food and energy prices is probably the best known and most closely followed by policymakers and the public. While the conventional "ex food and energy" measure is a composite of the price changes of a large number of different products and services, almost all models developed to explain and forecast its behavior do not distinguish between the goods and services categories. Is the distinction important? Here, we highlight the different behavior and determinants of goods inflation and services inflation and suggest, based on preliminary analysis, that we can improve the forecast accuracy of this conventional core inflation measure by combining separate inflation forecasts of the two categories. Every Picture Tells a Story (Don't It?) As specified in the Federal Reserve Reform Act of 1977, the Federal Reserve's mandate is "to promote effectively the goals of maximum employment, stable prices, and moderate long-term interest rates." Given long and variable lags between changes in monetary policy and the subsequent impact on the economy, meeting these goals is greatly facilitated by being able to accurately forecast the behavior of inflation over a one-to-two-year horizon. This, of course, is easier said than done, as headline inflation measures, such as Consumer Price Index (CPI), tend to be quite volatile, due in large part to sharp swings in energy and food prices.Because of the volatility in headline inflation, policymakers have relied on core inflation measures designed to differentiate between transitory and persistent price changes to help guide their decision making. Among the measures of core inflation, the "ex food and energy" series has been the most widely adopted for this purpose (see this paper by Timothy Cogley for a discussion of other core inflation measures). This measure, shown in the chart below, is a much less volatile series that is indicative of lower-frequency changes of the general price level and has also proved to be a more accurate predictor of headline inflation than past headline inflation. However, models developed to explain and forecast core inflation—such as Phillips curve models—do not have a particularly good track record, to the point that there is disagreement regarding the fundamental determinants of inflation. One possible explanation for this state of affairs is that core inflation is a composite of the price changes of a large number of different products and services that behave quite differently over time. The next chart presents core inflation at one level of disaggregation—commodities less food and energy commodities (or core goods) and services less energy services (or core services). Note that the absolute level of inflation of these two categories is quite different as are their weights in the core CPI; the weight of core goods was 34 percent in 1985, but was just 26.1 percent in 2012. Additionally, over the past decade, the two inflation rates have generally moved inversely to each other. It seems likely that the divergence in the behavior of goods inflation and services inflation may also carry over to their determinants. To explore this idea, we examine the relationship over the period since 1985 between each inflation series in the previous chart and two variables considered to be important in predicting inflation: long-run inflation expectations and the level of domestic resource utilization. Resource utilization provides a gauge of the balance between aggregate demand and supply in an economy. One of the most widely used measures of domestic resource utilization is the unemployment gap—the difference between the unemployment rate and the estimate of the time-varying Non-Accelerating Inflation Rate of Unemployment (NAIRU) from the Congressional Budget Office (CBO). The next two charts present scatter plots of the four-quarter-ahead inflation rates (period t to t+4) of core services and core goods, respectively, less a measure of ten-year expected CPI inflation (period t) from the U.S. Survey of Professional Forecasters, versus the CBO unemployment gap (period t). For core services, there is a nonlinear, negative relationship between the inflation rate and the unemployment gap. For core goods, however, no such relationship is present. What Explains Movements in Services Inflation and Goods Inflation? The core services inflation model draws upon the modeling approach outlined in this Federal Reserve Bank of Boston paper by Jeffrey Fuhrer, Giovanni Olivei, and Geoffrey Tootell. We find a strong relationship (both economically and statistically speaking) between core services inflation and long-term inflation expectations. There is also an important nonlinear relationship between core services inflation and the unemployment gap, indicating that the impact of changes in labor market slack on core services inflation depends on the level of slack itself. For the core goods inflation model, the results suggest a very different set of factors influencing the behavior of the series. We find persistence in the series, that is, core goods inflation depends on its own past value. Relative import price inflation—growth in (non-petroleum) import prices less core goods inflation—also matters, suggesting goods prices act as the linkage between supply shocks and core inflation. There is also evidence of a relationship between core goods inflation and expected inflation, but that the relevant inflation expectations are associated with a short-term (one-year) horizon. Last, we find no meaningful effect of the unemployment gap on core goods inflation, consistent with commentators who contend that it is global (and not domestic) economic slack that impacts core goods inflation. The Whole versus the Sum of the Parts The estimated models can be used to generate forecasts of core services inflation and core goods inflation, which can then be combined using the relative weights of each category in the core CPI. To provide a basis of comparison, we also produce forecasts from an estimated Phillips curve model of aggregate core CPI inflation that uses long-term inflation expectations, the unemployment gap, and relative import price inflation as explanatory variables. We estimate the models from 1985:Q1 to 2004:Q4, and then forecast out-of-sample for the post-2004 Q4 period. To construct forecasts of the "composite model," we use weights of 28 percent for core goods and 72 percent for core services—the relative weights in the core CPI in 2004. As shown above, the forecasts from the composite model capturing the differences in the determinants of the inflation process of core goods and core services are over 65 percent more accurate than the forecasts from the Phillips curve model ignoring those differences. While both models generally track the slowing in core inflation during the recent recession, the forecasts from the composite model have done a better job picking up the subsequent rebound in core inflation. Although they are not shown, we obtain similar results based on the post‑2007 Q4 period. While we recognize our analysis is preliminary, the results suggest that a further exploration of core services inflation and core goods inflation and their role in the core inflation process is warranted. ~~~~~ Disclaimer
Posted by Blog Author at 07:00:00 AM in Macroecon, Monetary Policy |
| How Alternative Investments Are ‘Misperception’ Posted: 11 Jun 2013 02:30 AM PDT The hype surrounding alternatives, such as hedge funds, comes too heavily from those collecting fees from the asset class–and many institutional investors are being fooled, according to Jay Youngdahl, a senior fellow at Harvard University’s Initiative for Responsible Investment and a health plan trustee. If video does not load, click here February 14, 2013 |


| You are subscribed to email updates from The Big Picture To stop receiving these emails, you may unsubscribe now. | Email delivery powered by Google |
| Google Inc., 20 West Kinzie, Chicago IL USA 60610 | |


0 comments:
Post a Comment