


The Big Picture |
- The Bond Market and Inflation
- Currency Markets Are Rigged
- Chronologic cover: Evolution of Daft Punk’s Get Lucky by decade
- 10 Wednesday PM Reads
- Fed Tapering: Asset Class Sensitivity
- Bad Chart: Hedge Funds’ Long Term Gains
- 10 MidWeek AM Reads
- Is the Cyclical Bull Over Or Is This Just a Pullback?
- Comedians in Cars Getting Coffee Season 2 Trailer
- Have We Seen the End of the Commodities Bull Run?
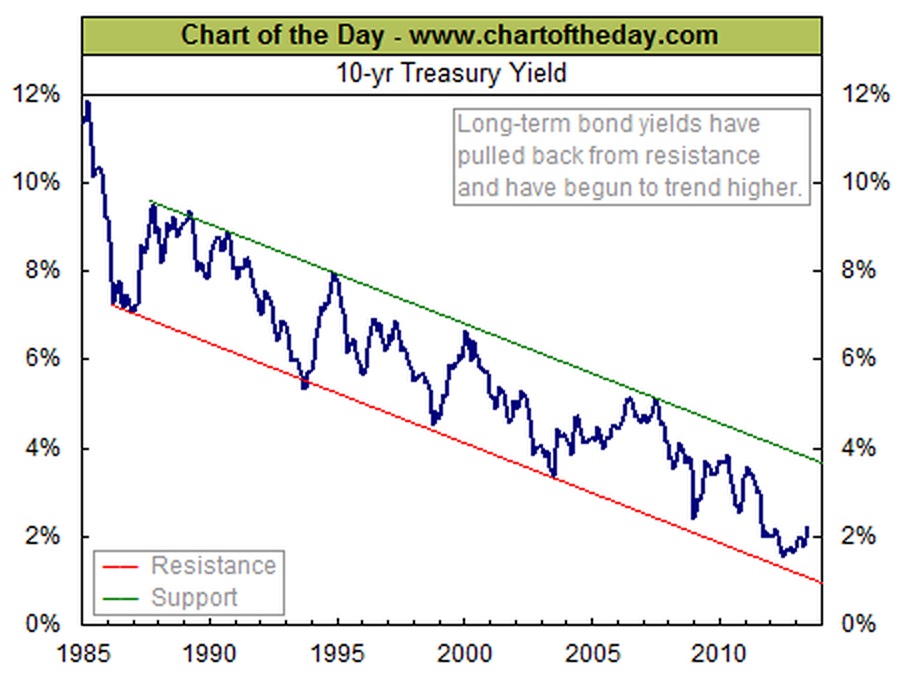
| Posted: 13 Jun 2013 02:00 AM PDT The Bond Market and Inflation
The wonderful book from which the above quotation was taken was written in the Great Depression era. It was first published by Wiley in 1933 and reached its sixth printing in June 1934. That is the edition I have in my personal library. Imagine writing a book about prices (inflation-deflation) in 1933. Europe was embroiled in post-Weimar inflation turmoil, and Hitler was coming to power. The US had elected Franklin Roosevelt to lead the country out of a depression and was devaluing the dollar in terms of gold. The Roaring 20s were ancient history, and the country was wondering if it could ever recover from the collapse of the American economic system. No one knew there would be another world war in only six or seven years. No one contemplated a German invasion of Poland (1939) or an attack on Pearl Harbor (1941). The book talks about prices. It discusses commodities and currencies and falling prices and how to stabilize prices. It is jammed with data. The charts end with the year 1933. Some of them start with the American Civil War. Others include price-index construction dating back to the beginning of US official national history. The book was assembled before the US went off the gold standard and covers the period of time when money was gold and/or silver. And it talks about price change in those terms. Lessons from this classic text are applicable today, including its references to distortions in markets. For the last few weeks we have seen bonds selling off viciously as a result of confusing communications from the major central banks. Bonds may be reacting to some changes in inflation expectations, but the inflation evidence does not support this view. In our opinion the bond market adjustment is too extreme and has created bargains in bonds. We are seeing the very highest grade tax-free Munis yielding above 4%. Some trades are at 125% to 130% of the referenced long-term taxable treasury. That pricing is absurd. A taxable equivalent yield calculation for a highly taxed American investor is now above 7% and as high as 8% in certain states. At the same time, inflation statistics are pointing to downward pressure on the price indices. Those statistics seem to be indicating tepid economic growth pressure and a rising risk of weakening in many economies around the world. There are signs of a fear of deflation risk appearing in markets. If markets have overreacted and bonds are very cheap due to poor communication policies of central banks, then that presents a buying opportunity in tax-free bonds, and we will take advantage of it at Cumberland. We are now lengthening duration and widening some of the hedging strategies in our managed accounts. If the market wants to give us bargains, our job is to take them. We will close with this wonderful gem from Prices: If one had left an estate with a guaranteed annual income of $100 per year in gold in the United States or in England in 1873, and if the guarantee had been fulfilled, by 1896 the beneficiary would have had a purchasing power of twice the anticipated amount. This was due to low gold production. If a similar provision had been made in 1896, the buying power of the income by 1913 would have shrunk to two-thirds the anticipated amount. This was due to finding large amounts of gold. By 1920, the added fact of low demand for gold would have cut the buying power to less than one-third of the anticipated amount. If the investment had been made in 1920, and if the agency paying the dividends had not gone bankrupt, the buying power would have increased almost two and one-half times by 1932. This was due to low demand for gold for money in other countries, followed by high demand. The instability is much greater than the above figures indicate, particularly when prices decline. If prices rise, the buying power declines but the agency which agrees to make the payment is likely to remain solvent so that some income is secured. If prices decline too much, the buying power of the income would be greatly increased if obtained, but the agency that agreed to make it would likely be insolvent. ~~~ |
| Posted: 12 Jun 2013 10:30 PM PDT EVERY Market Is RiggedBloomberg reports today:
Interest Rates Are ManipulatedUnless you live under a rock, you know about the Libor scandal. For those just now emerging from a coma, here's a recap:
Derivatives Are ManipulatedThe big banks have long manipulated derivatives … a $1,200 Trillion Dollar market. Indeed, many trillions of dollars of derivatives are being manipulated in the exact same same way that interest rates are fixed: through gamed self-reporting. Commodities Are ManipulatedThe big and and government agencies have been conspiring to manipulate commodities prices for decades. Gold and Silver Are ManipulatedThe Guardian and Telegraph report that gold and silver prices are "fixed" in the same way as interest rates and derivatives – in daily conference calls by the powers-that-be. Oil Prices Are ManipulatedOil prices are manipulated as well. Everything Can Be Manipulated through High-Frequency TradingTraders with high-tech computers can manipulate stocks, bonds, options, currencies and commodities. And see this. Manipulating Numerous Markets In Myriad WaysThe big banks and other giants manipulate numerous markets in myriad ways, for example:
|
| Chronologic cover: Evolution of Daft Punk’s Get Lucky by decade Posted: 12 Jun 2013 04:30 PM PDT |
| Posted: 12 Jun 2013 01:30 PM PDT My afternoon train reads:
What are you reading?
27-year trend of the 10-year Treasury bond |
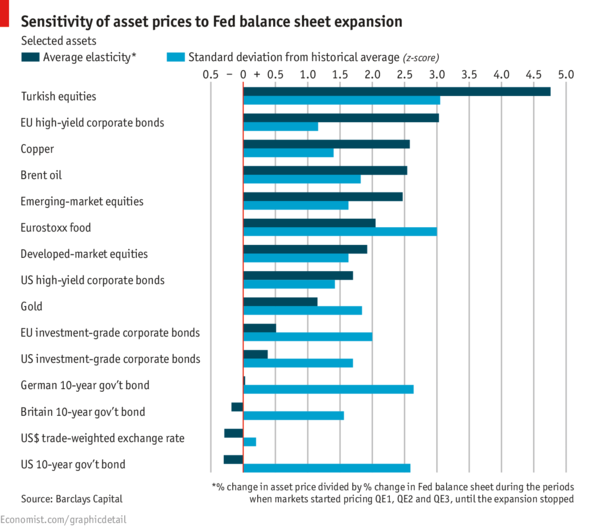
| Fed Tapering: Asset Class Sensitivity Posted: 12 Jun 2013 11:30 AM PDT |
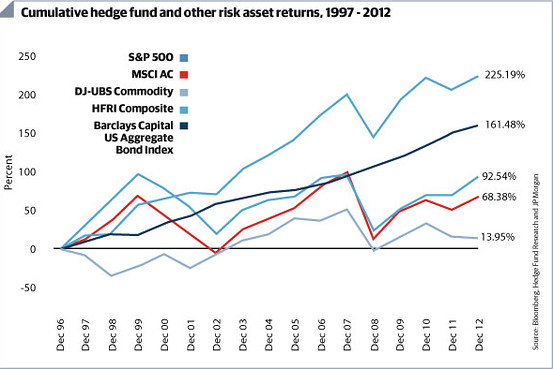
| Bad Chart: Hedge Funds’ Long Term Gains Posted: 12 Jun 2013 08:45 AM PDT Click to enlarge
I have been in the midst of a big research project that has led to me looking askance at the claims and long term returns of hedge funds. It began with the research I did for Romancing Alpha, Forsaking Beta, and has led to other interesting places. But as we have learned, some things are not as they appear. The chart above is a case in point This is one of those return charts that looks impressive when you first see it, but once you delve deeper you learnt hat it is actively misleading. It is a time weighted return series, and as such, shows the annual returns of managers regardless of assets under management (AUM).A more honest display would be an asset weighted return series. Here is why: Imagine a manager who is up 10% every year for 9 years, then down 30% in year 10. You might think he is creating a lot of Alpha and net net has created a lot of wealth. But having done some research, I now know quite a few things I did not last year:
(Note: We haven’t even touched upon all of the errors that are on the Hedge fund index — survivorship bias, backfill problem, self reporting issues, etc.). Which brings us back to our theoretical manager 10% for years with a 30% loss in year 10: Imagine he is a John Paulson like manager, who did really well until he hit the wall. His best years were when the firm was small — up 10% when its a $50-$150 million fund. His gains are low millions, even 10s of millions. Then after a few big rounds of publicity, the funds he manages swell to several billion dollars. Down 30% wipes out all of the gains of the prior decade — and then some — in asset weighted series. But in a time-wighted series, he looks pretty good. Its an epic fail, a colossally misleading returns . Which is of course why so many managers love them!
Source:
|
| Posted: 12 Jun 2013 07:00 AM PDT My morning reads:
What are you reading?
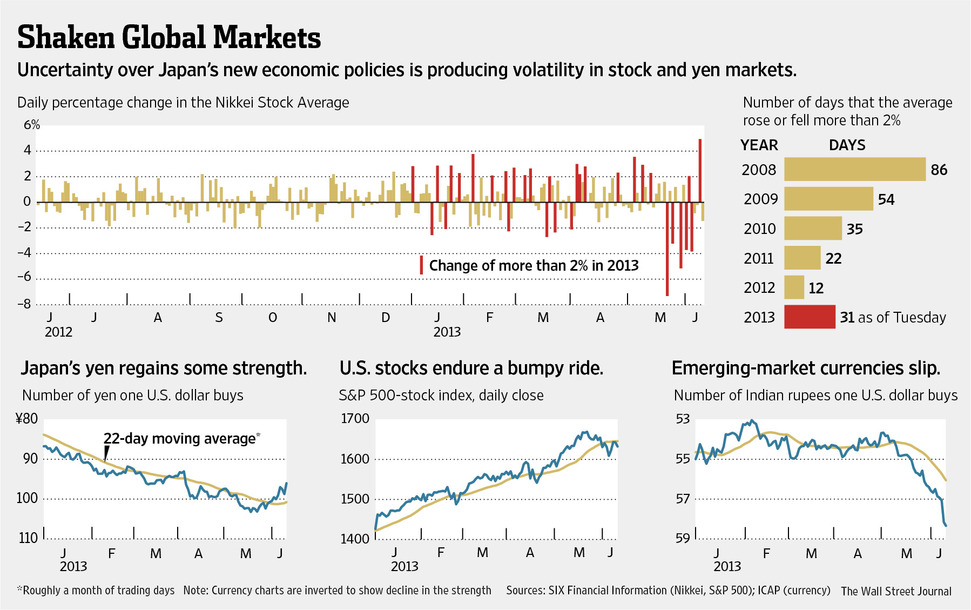
Bumpy Return to Normal or New Volatility as Central Banks Step Back? |
| Is the Cyclical Bull Over Or Is This Just a Pullback? Posted: 12 Jun 2013 04:23 AM PDT Since the peak in May, global markets have been bouncing about. There have been various explanations given for these crosscurrents, but few ring true to this seasoned trader. Perhaps we can derive a better explanation as to what this might mean. Let’s start in Asia, where the Japanese Nikkei Dow 225 has been setting off fireworks. The spectacular run over the past year was caused in large part by changes in the government, especially the massive fiscal and monetary stimulus put into place by newly elected Prime Minister Shinzo Abe (hence the term Abenomics). On a comparative basis, Japan's monetary stimulus is three times the size of that in the USA. The Japanese version of ZIRP/QE sent the Yen plummeting, making Japanese exports that much more attractively priced and goosing profits — and stock prices. Last year at this time, the Nikkei was at 8,300; since then, it has almost doubled to 16,000. The month of May saw the Yen begin to recover a bit, the most likely catalyst for Japan's recent retreat from its unsustainable market pace. Since the Nikkei's May 22nd highs, the Nikkei has dropped almost 20%. My best guess is it was simply a case of too far, too fast. The rest of the Pacific Rim (ex-Japan) fell almost 10% for the month; New Zealand and Australian equity markets were down nearly 13% in May (best guess: fears of slowing imports from China). If we look at the total MSCI World index, it slipped 0.3% for the month. Here in the US, markets finished up 2.3% in May (including dividends) despite a few ugly Fridays and a big increase in volatility. May started with the Dow at 14,840, ran up to 15,542 before finishing at 15,116. The S&P500 started the month just under 1600, ran to 1680 before closing May at 1631. Gaining over 2.1% in a month doesn't seem like much – but annualized that's more than a 25% return, a pace that is clearly unsustainable. Indeed, before the 2nd quarter is even over, US equity markets have tacked on more than 15%. In most full years, investors would be thrilled with those gains; in less than half a year, its simply another case of too much stimulus driving risk assets too far too fast. As Josh noted, May marked a turning point in how markets are behaving. Regardless of your posture, it is clear that the tone changed significantly. Whenever we have these pullbacks, even if they appear to be a case of markets simply readjusting to a normal, sustainable pace, I look to look at the market's Internals — these provide a snapshot of the market's health. As to the volatility, we know that a 10% correction comes around every once each 2 years, and that we can count on three corrections of 5% over that same time period. We cannot predict these, and have yet to find anyone else who can. We simply accept this as a part of investing, and compose our portfolios with that in mind We also try to make sure that emotionally, we are prepared for these inevitable hiccups. Last month, I mentioned in our letter to clients "It would not be a big surprise to us if the markets get a little soft over the next quarter or two." So far, nothing we see undercuts that view. Given our longer-term perspective, we would rather not make a wild guess as to when this cyclical market is going to end. So far, we see no data supporting the most extreme and negative views. As such I continue to give this bull market the benefit of the doubt.
|
| Comedians in Cars Getting Coffee Season 2 Trailer Posted: 12 Jun 2013 03:00 AM PDT Season one is now on YouTube — here is the preview for Season 2
Click for video |
| Have We Seen the End of the Commodities Bull Run? Posted: 12 Jun 2013 02:30 AM PDT On today’s “Futures In Focus,” Bloomberg News commodity reporter Elizabeth Campbell looks at whether the bull market in commodities is over and what is pressuring prices. She speaks on Bloomberg Television’s “Market Makers.”
|

| You are subscribed to email updates from The Big Picture To stop receiving these emails, you may unsubscribe now. | Email delivery powered by Google |
| Google Inc., 20 West Kinzie, Chicago IL USA 60610 | |


0 comments:
Post a Comment