


The Big Picture |
- How Another Housing Bubble Was Blown … And Why
- Daft Punk: Covers of Get Lucky, Game of Love
- 10 Thursday PM Reads
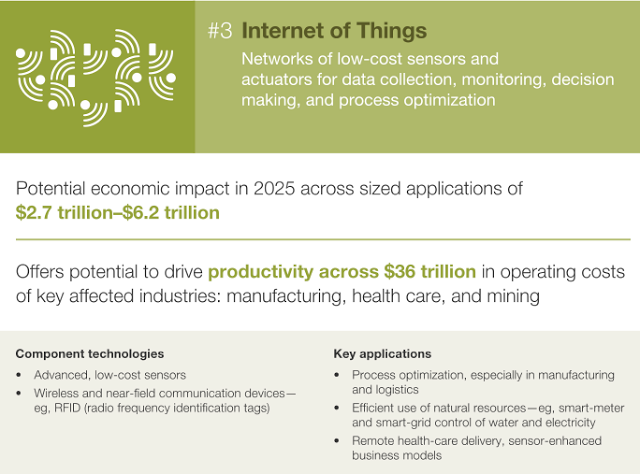
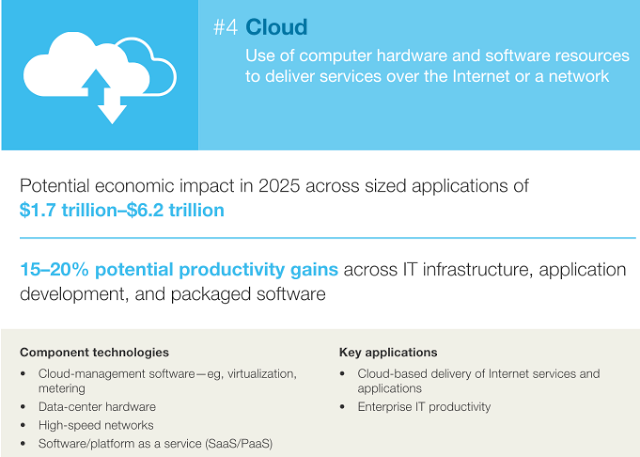
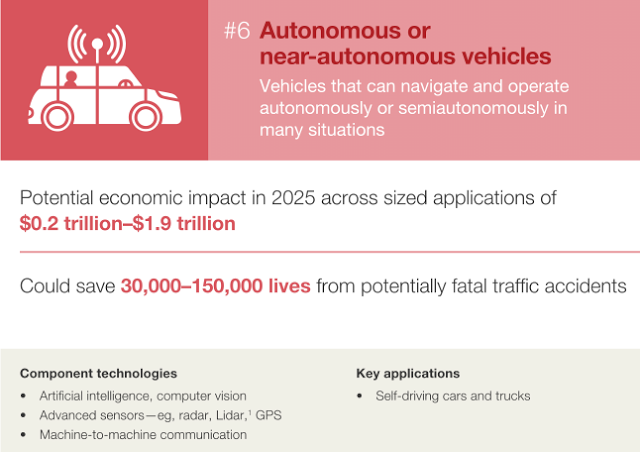
- Disruptive Technologies: Advances That Will Transform Life, Business, and the Global Economy
- S&P500 Index to Profits at all U.S. companies
- 10 Thursday AM Reads
- Forward Markets: Macro Strategy Review
- Saut: Hindenburg Omen Is Just Hot Air
- Media Appearance Bloomberg TV (6:00-7:00am)
| How Another Housing Bubble Was Blown … And Why Posted: 06 Jun 2013 10:30 PM PDT The REAL Reason Housing Prices Have Skyrocketed
Preface: In Part 1, we showed that mortgage applications are down, and it is really institutional investors driving the housing boom. Part 2 explains why. Housing prices have boomed because:
Artificially Suppressed Housing InventoryNaked Capitalism reported last August:
Indeed – in the real world - 12.6 million houses are vacant … 1.5 million more home than are underwater. In other words, without artificial scarcity created by banks, there would be more available houses than there are underwater homeowners having problems paying their mortgage. There would – in a word – be a glut. Government Is Secretly Helping Financial Companies to Snap Up HousingThere are realistic ways to help the economy. For example:
But instead, the government's entire strategy is to try to paper over all of the real problems with the economy by artificially propping up asset prices in an attempt to hide the fact (which has been obvious for years) that the big banks are insolvent. Stocks, for example, are largely being driven by insiders and government policy. Indeed, we've pointed out for years that all of the Obama administration's "homeowner relief" programs are really just back-door bailouts to the big financial companies … and are not even intended to help homeowners. Mike Whitney explained last September:
And if that isn't hard-hitting enough for you, Jim Quinn writes:
Of course, economist Michael Hudson would put it a little differently: banks are trying to roll back all modern laws and make us all into serfs. In other words, the giant financial service companies are attempting to privatize public resources, socialize losses, scam people out of their homes and other private property … and then rent back to us what we used to own for a hefty price. Do you understand the game now? |
| Daft Punk: Covers of Get Lucky, Game of Love Posted: 06 Jun 2013 03:00 PM PDT Last week, we published Bob Lefsetz’ discussion of The Daft Punk Album. Tonite, a couple of outstanding covers of a few songs on the album: —————————————-——————————- San Cisco put a different spin on Daft Punk’s huge tune ‘Get Lucky’ with some very unique percussion (read: bongos). Like A Version is a segment on Australian radio station triple j. Every Friday morning a musician or band comes into the studio to play one of their own songs and a cover of a song they love. You can stream triple j online at http://www.triplej.net.au ~~~ Daft Punk – Get Lucky // George Barnett cover ▶ Facebook: http://www.facebook.com/georgebarnett.uk Contains an interpolation of Rudy Love & Love Family’s “Does Your Mama Know”. ~~~ Game of Love http://facebook.com/meiosism http://twitter.com/meiosism Daft Punk – Random Access Memories |
| Posted: 06 Jun 2013 02:30 PM PDT My afternoon train reading:
What are you reading?
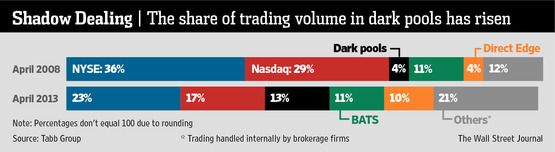
‘Dark Pools’ Face Scrutiny |
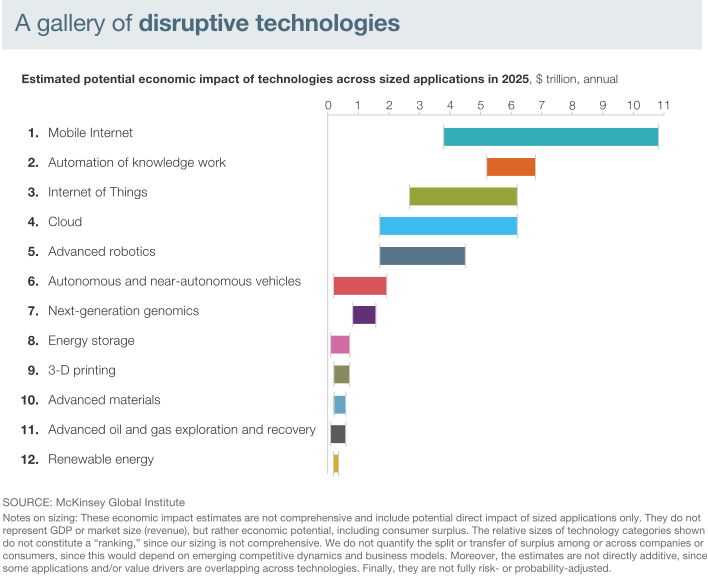
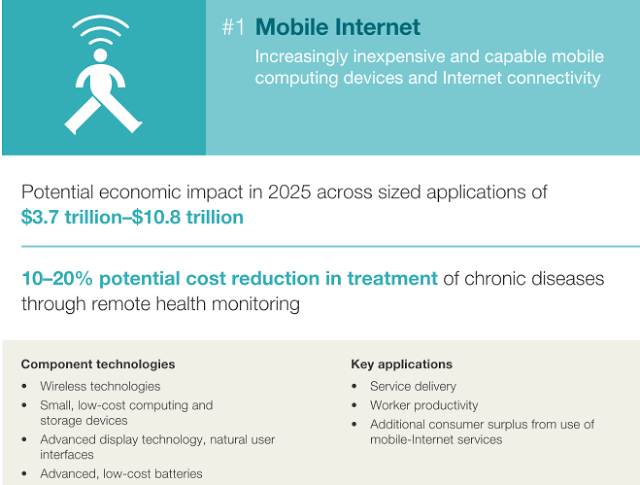
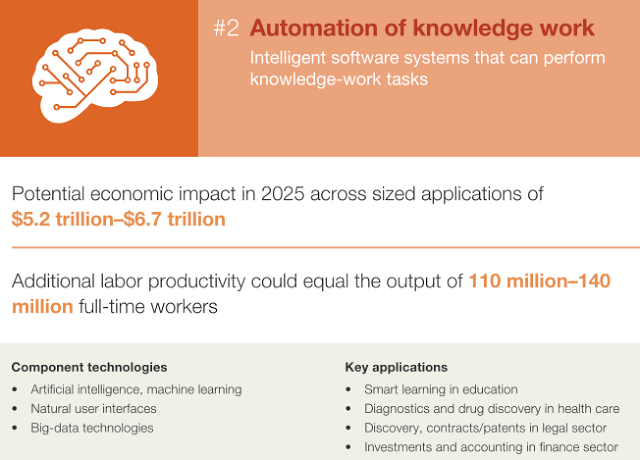
| Disruptive Technologies: Advances That Will Transform Life, Business, and the Global Economy Posted: 06 Jun 2013 11:30 AM PDT Fascinating reading: Download the full report here.
Click to enlarge Source: McKinsey and Company Hat Tip Next Big Future |
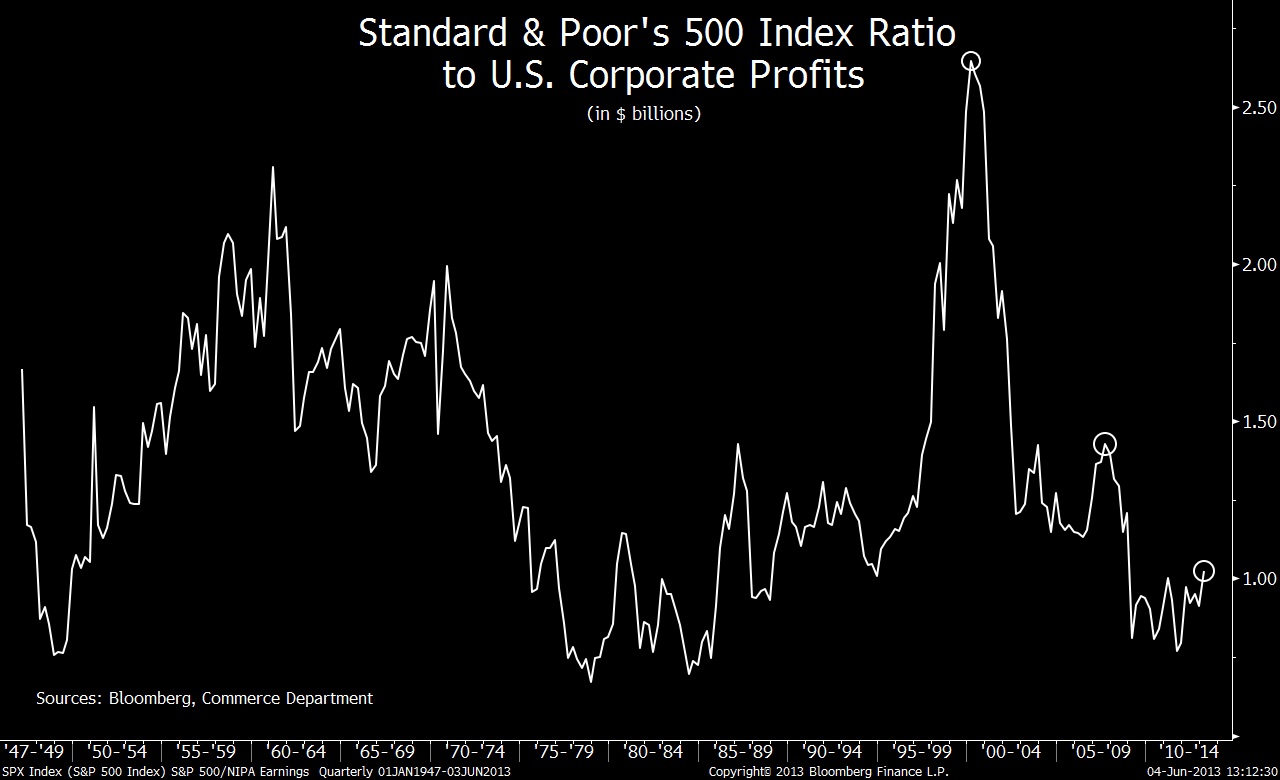
| S&P500 Index to Profits at all U.S. companies Posted: 06 Jun 2013 09:00 AM PDT Click to enlarge
I have to admit: I have never seen this ratio before. Standard & Poor's 500 Index to profits at all U.S. companies. Its a price to earnings ratio of the main US stock market against ALL US earnings. According to this little used, odd ratio, Stocks are much cheaper after four years of gains than they were in the two previous bull markets. This look at corporate earnings is based on work by Neil Dutta, head of U.S. economics at Renaissance Macro Research LLC. In the above chart. we see a ratio shows, the ratio of the Standard & Poor's 500 Index to profits at all U.S. companies, as compiled quarterly by the Commerce Department and expressed in billions of dollars. For the first quarter, the reading was 1.02. Although the latest ratio was the highest since 2008, it was far from peaks of 1.43 in the third quarter of 2007 or 2.65 in the first quarter of 2000, as the chart shows. Both readings were posted near the end of multiyear gains in share prices. Dutta said "The stock market's performance has been well supported." I am not quite so sanguine. The good news is 2013 Q1 operating earnings equaled $25.76 on a per-share basis, based on results reported as of last week. The bad news? Well, look at your screens the past few weeks . . .
Source: |
| Posted: 06 Jun 2013 07:00 AM PDT My morning reads:
What are you reading?
SEC Ready to Curb Money Funds |
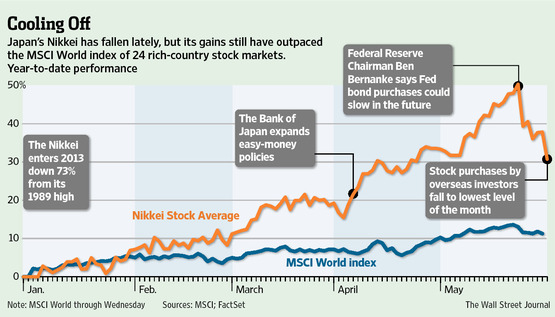
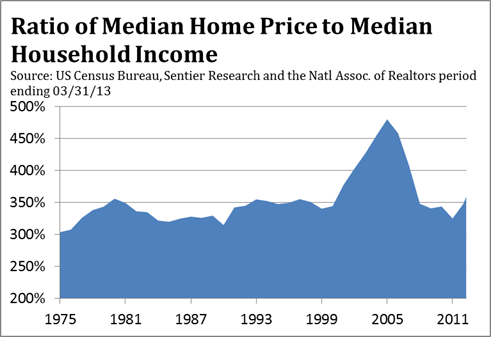
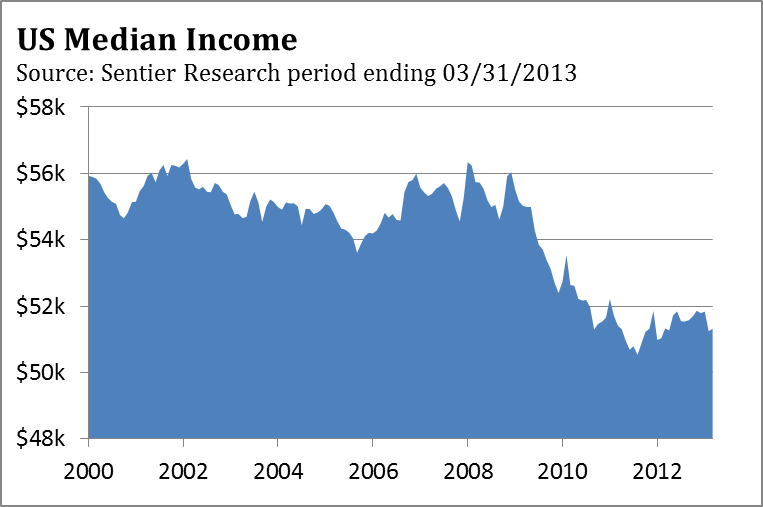
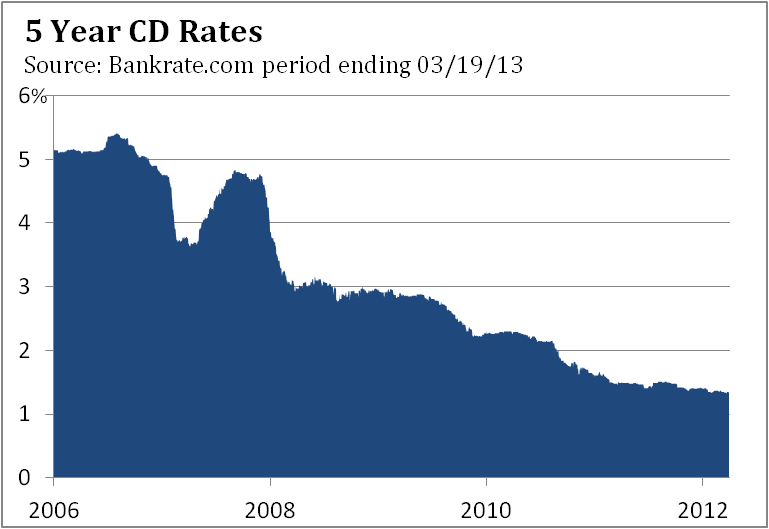
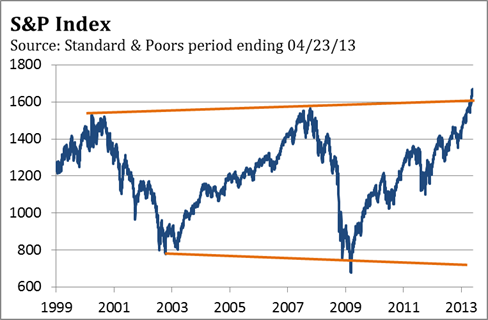
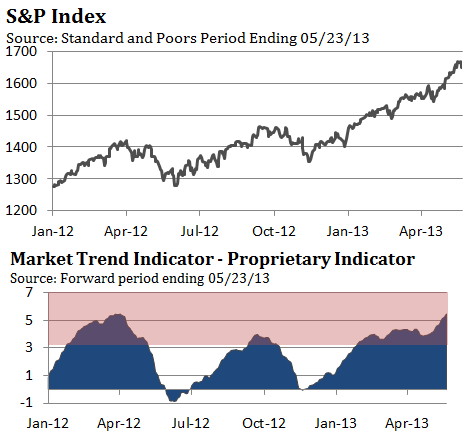
| Forward Markets: Macro Strategy Review Posted: 06 Jun 2013 05:00 AM PDT On December 5, 1996, Federal Reserve Chairman Alan Greenspan gave a speech entitled 'The Challenge of Central Banking in a Democratic Society'. We imagine many in the audience found it difficult not to nod off, but one phrase from his speech became memorable. "Clearly, sustained low inflation implies less uncertainty about the future, and lower risk premiums imply higher prices of stocks and other earning assets. We can see that in the inverse relationship exhibited by price/earnings ratios and the rate of inflation in the past. But how do we know when irrational exuberance has unduly escalated asset values, which then become subject to unexpected and prolonged contractions as they have in Japan over the past decade?" The S&P 500 more than doubled after Greenspan's speech, climbing from 744 to 1,553 in March 2000, according to Bloomberg. If he had reservations on a central bankers ability to spot irrational exuberance before his speech, the doubling in the S&P500 in just over 3 years only reinforced it. Greenspan ultimately concluded that rather than trying to identify a burgeoning bubble, and taking action to let the air out before it became too large, the Federal Reserve would simply deal with the fallout should one occur. After all, the Federal Reserve had been able to handle the fallout from the stock market crash in 1987, which in percentage terms was comparable to the 1929 crash. The 1998 collapse of Long Term Capital Management came close to being a systemic crisis, relatively small compared to Lehman Brothers in 2008, but the Fed dealt with it. The Fed's playbook under Chairman Greenspan was the same: flood the banking system with liquidity, stabilize the financial system, and the crisis will pass. It worked in 1987, 1998, less well in 2001, but not so well since the 2008 financial crisis. We think the Federal Reserve overestimated its capability to handle asset deflation, especially after an asset's valuation was allowed to exceed prior valuation peaks by 40% to 50%. The philosophical decision to be reactive rather than proactive in dealing with asset prices is interesting since the Federal Reserve has always been proactive when dealing with the economy. If strong growth raised inflation during the 1950's, 1960's and 1970's, the Fed would eventually increase interest rates, slowing growth enough to bring inflation down and not infrequently (1954, 1958, 1961, 1969-1970, 1973-1974, 1980, and 1981-1982) tip the economy into recession. Once a recession did develop, the Fed promptly lowered rates to revive growth. The Federal Reserve's choice of allowing asset prices to find their own level was also based on the belief that markets are wiser than bureaucrats in establishing an appropriate valuation for any asset. While we generally support this view, we also recognize that the dot.com bubble proved that markets are hardly infallible. What's interesting is that the Federal Reserve, under Alan Greenspan's leadership, had a ring side seat as the housing bubble was forming so soon after the dot.com bubble and still remained reactive rather than proactive. As the Nasdaq Composite was doubling in 1999 and 2000, the philosophical decision to be reactive rather than proactive was reflected in the Federal Reserve's decision not to increase margins for stock purchases, which would have curbed the level of speculation in technology stocks in 1999 and 2000 without harming the overall economy. But how do we know when irrational exuberance has unduly escalated asset values? As the housing bubble was forming after 2004, the Federal Reserve failed to respond from a regulatory standpoint to oversee the availability of mortgages that allowed a home owner to borrow 125% of their homes value, or supervise the lax lending standards that became pervasive throughout the country. Starting in June 2004 the Federal Reserve increased the Federal funds rate .25% at 17 consecutive FOMC meetings until it was 5.25%. Although rates had been increased, home buyers had many mortgage options which made it easy for them to circumvent the impact of the higher Federal funds rate. Demand increased even as the Fed raised rates, increasingly powered by lax lending standards and liar loans. From 1965 until 2000, the median home sold for about 333% of median income. By 2006, home prices rose to 475% of median income. In just six years, median home prices were more than 40% higher relative to median income than they had been at any time since at least the mid 1960's. Many of the 'hot' markets were even more stretched. Although a central banker may not be able to know for sure when a bubble is forming, these valuations were less than a subtle hint that home prices had become unduly elevated. We do not believe the Federal Reserve was primarily responsible for the housing bubble, as some have suggested. The housing bubble developed because there were many contributions from many contributors. Each political party pursued their respective political agenda or philosophy; the rating agencies were compensated by the issuers of mortgage securities which created a serious conflict of interest that potentially compromised their ability to be 'objective'; mortgage brokers who received higher commissions even when they sold a more expensive mortgage to an unsuspecting homeowner or assisted in filling out the application for a questionable home buyer; Wall Street investment banks which continued to distribute mortgage backed securities even after they suspected some of the MBS wasn't worthy of their AAA rating; speculators who bought multiple homes with no money down expecting a quick profit; and all those willing to game the system because there was simply too much money to be made for everyone involved. The gravy train gained speed as it rolled downhill, while the Federal Reserve remained a passive observer. It is somewhat ironic that after not proactively responding to asset price fluctuations and allowing two bubbles to form in less than a decade, the Bernanke Federal Reserve in recent years has pursued an aggressive proactive approach that is intended to influence asset prices. Rather than being indifferent to asset prices, the Fed is very much interested in manipulating them as part of current monetary policy. By holding the Federal funds rate just above 0% for the last five years, and launching quantitative easing programs that currently include purchasing $85 billion of Treasury bonds and mortgage back securities every month, the Federal Reserve has charted a course that has already resulted in a number of intended consequences. After working hard for decades, saving money, and possessing a nest egg that would allow them to retire comfortably, those prudent savers who retired before 2007 have been crucified by the Federal Reserve's low interest rate policy. In 2007, they could safely invest in a 5-year Certificate of Deposit and earn at least 5.0% on their savings. When that CD matured last year, they were confronted with a frightening new reality. Rather than receiving $5,000 each year for every $100,000 invested, they would be lucky to earn $1,000 – a decline of 80%. For those heavily dependent on interest income, this 80% plunge in income is why the demand for Reverse Mortgages is growing, and why the demand for income producing bonds and stocks has been growing. Another unintended consequence of the Federal Reserve's proactive monetary policy is its impact on pension funds, both public and private. By law pensions are required to calculate the present value of future liabilities using a discount rate based on current interest rates, current assets, future contributions, and for individual workers, their time of service, income level, and life expectancy. This is not an exact science since employees come and go, and interest rates and investment returns can and often change dramatically in any given year. Based on all these variables pension actuaries estimate how much money a pension fund will need over the next 10, 20, and 30 years to pay retired workers their promised benefits. In the following example we are excluding annual contributions to keep the math simple. For instance, an actuary determines a pension with $50 million in assets today will need $400 million in 30 years to meet its obligations. What rate of return does the pension have to earn to ensure there will be $400 million available in 30 years? The $50 million would double every 9 years if the fund earned an average annual return of 8% based on the rule of 72 (72/8% = 9 years). So after 27 years, the $50 million would have doubled three times and be worth $503 million in 30 years. However, if a discount rate of 6% is used as the expected average annual rate of return, the $50 million will have quadrupled in 24 years (72/6% = 12 years) and only have $284 million to meet its obligations in year 30. The difference between 8% and 6% doesn't sound like a lot, but over time the effect of compounding becomes very significant and has a large impact on the annual employer contribution. The discount rate used by corporations to determine their pension contribution is based on the yields of corporate bonds rated double A or higher with maturities equal to the schedule of pension benefit payouts. As our example showed, the shortfall caused from a lower investment return can be significant and must be narrowed by larger contributions by the employer. As a result of the Federal Reserve's monetary policy actions and quantitative easing programs, corporate bond yields have fallen dramatically. A good thing for corporate borrowing, not so good for corporate pensions. Mercer is an employee benefit specialist that advises pensions on all aspects of pension management. The Mercer Yield Curve Mature Plan Index is one of the rates used by large corporations as their discount rate. Since December 2007, the Mercer Index's yield has plunged from 6.4% to 3.65%, which has created near record pension deficits. According to Mercer, the 1,500 companies in the S&P 1500 stock index had a combined deficit of $607 billion as of November 30, 2012. Although pension portfolios benefited from the 16% gain in the S&P 500 in 2012, the decline in interest rates more than offset it, lifting the deficit from $484 billion at the end of 2011 by $123 billion. In 2013, Ford expects to contribute $5 billion to its pension fund, which is almost as much as it spent building plants, buying equipment, and developing new cars in 2012. In the fourth quarter, Verizon Communications contributed $1.7 billion to its pension plan. In a recent securities filing, Boeing said a .25% drop in its discount rate would add $3.1 billion to its pension obligations. At the end of 2012, Boeing reported a pension deficit of $19.7 billion. According to J.P. Morgan Asset Management, companies hold only $81 for each $100 promised to pensioners. The pension underfunding gap for public pensions is worse. At the end of 2012, the shortfall in 109 of the nation's state pension plans rose to $834 billion, up from $690.3 billion in 2011, according to Wilshire Consulting. In 2012, assets only amounted to 69% of liabilities, down from 93% in 2007. According to Wilshire Consulting, these plans expect to average a median rate of return over the next 30 years of 7.8%. Returns over the last decade fell well short of 7.8%, and with 30-year Treasury bonds and high quality corporate bonds yielding less than half of 7.8%, it is an understatement to suggest this expected return is not realistic. The primary reason state and local governments have not lowered their expected return rate is a lower rate would require larger contributions now and in coming years. With many state and local government budgets under pressure, it is easier for politicians to ignore the problem. Who knows, maybe trees can grow to the sky! Besides state and local governments have an Ace in the Hole corporations don't have. The California Public Retirement System (CalPers) has $255 billion in assets to cover present and future obligations for its 1.6 million members. In March, CalPers published a report that a number of state and school pension funds are only 62% to 68% funded for obligations in the next 10 years, and only 79% to 86% funded out to 30 years. To close the funding gap, CalPers approved a 50% increase in contributions for those cities and school districts for the next six years. These cities and school districts will likely pay for the increase in their pension contributions by tapping taxpayers with higher taxes and fees, and rewarding those footing the bill with reductions in services. Chicago's pension fund is underfunded by almost $24 billion, and must contribute $404 million this year to the teachers' retirement system this year, which represents 8% of the 2014 education budget. Over the next three years, Chicago's annual pension costs will soar from $500 million to $1.1 billion, and that figure does not include the teacher's pension contribution. One anti-dote for the pension underfunding problem would come from higher interest rates, as they would raise the discount rate corporations use, and lower the amount they would have to contribute to their pensions. Higher rates would also help state and local governments lower their annual contributions since higher rates narrows the gap between current rates and the 7.8% median rate of return expected by state and local governments. But we live in a time when the law of unintended consequences is the rule rather than the exception. As policy makers address one problem, another problem pops up. After the financial crisis erupted, the Federal Reserve went to the playbook it has relied upon since the 1987 crash. The Fed injected a massive amount of liquidity into the banking system, cut rates to stabilize the financial system, and then waited for the recovery to take hold as it has in the past. It didn't take long for the Fed to realize it would require an extraordinary proactive monetary policy to offset the deflationary forces of banking and consumer deleveraging. Lowering interest rates to help housing and auto sales has always been part of traditional monetary policy, and we would suggest the initial round of Quantitative Easing was more of an extension of traditional policy. The goal of QE3, however,and the expansion of QE3, is to boost asset prices so consumption can remain strong enough as fiscal tightening becomes a headwind. With stocks and bonds hitting new all time highs and home prices recovering, this strategy is working. With time and higher asset prices, the Federal Reserve and the other central banks can only hope real economic growth accelerates. This is a strategy that is fraught with unforeseen risks, but the central banks have no choice. This raises a good question. If central bankers aren't able to identify an asset bubble, even though the tech and housing bubbles were somewhat obvious, how will they know when irrational monetary policy has unduly escalated asset values? If and when the Federal Reserve begins to scale back QE3, stocks and bonds are likely to fall, erasing some of the paper wealth created by the psychology of QE3. Some will point out that the Fed will only reduce QE3 if the economy is doing well, so stocks should hold up. When QE1 and QE2 ended investors will remember the stock market declined, so they will be inclined to sell and ask questions later. Investors will also worry the economy may soften too much without the assist from QE, especially if a couple of data points come in weaker after the Fed has scaled back on QE3. Bond prices are likely to sag as well, since the supply the Fed has been soaking up will have to be bought by other buyers. When the Fed decides to increase rates, the higher rates will help savers and pensions, but hurt housing and autos sales. Most importantly, higher interest rates will increase the interest expense on the mountain of debt our economy is lumbering under. As noted last month, according to the Federal Reserve, for each $1 in GDP there is $3.50 of debt. Federal debt now exceeds $16 trillion and the Treasury is paying an average interest rate of just 2.6%. For each 1% increase in the Treasury's funding cost, the Congressional Budget Office estimates interest expense will go up by $100 billion, which won't make lowering our budget deficit any easier in coming years. The States Project, a joint venture of Harvard's Institute of Politics and the University of Pennsylvania's Fels Institute of Government, estimated last December that state and local governments now owe a total of $7.3 trillion in debt. According to studies by the Pew Center on the States, states and large cities have made more than $700 billion in promises for retiree health care insurance, but have set aside only 5% of the money to pay for the insurance. Higher interest rates will not be beneficial for state budgets either. We continue to believe the greatest risk to the Federal Reserve's proactive monetary policy is that it will be as successful as the Fed's reactive policy. As we noted at the beginning of our discussion, Federal Reserve Chairman Alan Greenspan asked, "How do we know when irrational exuberance has unduly escalated asset values, which then become subject to unexpected and prolonged contractions?" At this point we know the answer. What we do not know is what the unintended consequences of the Federal Reserve's and other central banks proactive monetary policy will be. For investors the coming months and years could prove treacherous, since the psychology of QE3 is likely to lift stock and bond prices further. We just don't know when the music will stop. Should central banks' proactive policy fail to result in a self sustaining economic expansion, the global economy will be at risk to suffering a Japanese like lost decade, and investors will lose confidence. If the central bank proactive policy succeeds, the financial markets could be vulnerable to a large increase in volatility that results in declines in both stocks and bonds as monetary policy around the world is normalized at some point in the future. This suggests that a tactical approach to the financial markets is warranted, since no one knows whether this monetary experiment will succeed or fail. Stocks As discussed in the April commentary, the S&P 500 was approaching an important trend line which connected the highs in 2000 and 2007. The overall formation since 1999 is potentially a broadening top which looks like a megaphone. On May 3, the S&P punched through this resistance after a better than expected employment report. We thought a break out above 1,600 could lead to a blow off that could carry the S&P to 1,680 – 1,700, inspired by the bullish psychology surrounding QE3. On May 22 the S&P traded up to 1,687 before reversing lower. The Major Trend Indicator (MTI) is a proprietary indicator we use to measure the strength or weakness of market rallies and declines. Whenever a rally carries the MTI above 3 (shaded area), it is because investors have a number of fundamental reasons to be buyers and is a sign of market strength. The recent rally pushed the MTI to 5.46, but that does not convey how historic the recent rally has been. A Buying Stampede occurs when the market doesn't experience a three consecutive day of pullback as it progresses higher. The vast majority of Buying Stampedes last between 17 and 25 trading days, with few lasting more than 30 days, according to Raymond James. Since the end of December the current Buying Stampede has persisted for 100 trading days, almost double the prior record of 53 days. Source: |
| Saut: Hindenburg Omen Is Just Hot Air Posted: 06 Jun 2013 04:00 AM PDT |
| Media Appearance Bloomberg TV (6:00-7:00am) Posted: 06 Jun 2013 03:00 AM PDT Bloomberg Surveillance
I am going to be on Bloomberg TV/Radio this morning with Tom Keene and Sara Eisen from 6:00 – 7:00am. Also scheduled to be on is Drew Matus of UBS, Elliot Weissbluth of HighTower Advisors, and Brad Adgate of Horizon Media (I have to add Brad to my list of people who have names that help explain what they do for a living).
The live TV streams here.
|


| You are subscribed to email updates from The Big Picture To stop receiving these emails, you may unsubscribe now. | Email delivery powered by Google |
| Google Inc., 20 West Kinzie, Chicago IL USA 60610 | |


2 comments:
Hi, I do believe this
is a great web site. I stumbledupon it ;) I may revisit once again since I book marked it.
Money and freedom is the greatest way to change, may you
be rich and continue to guide others.
my web site ... car insurance comparisons ()
Ahaa, its pleasant discussion concerning this paragraph at this place
at this
blog, I have read all
that, so now me also commenting at this
place.
Here is my blog post :: forex futures []
Post a Comment