| Succinct Summation of Week’s Events (7.12.13) Posted: 12 Jul 2013 12:30 PM PDT Succinct Summations week ending July 12, 2013. Positives: 1. Bernanke stressed rates to stay low for extended period of time, market rallies to all-time highs.
2. S&P 500, Dow Jones Industrial average and Russell 2000 all made new all-time closing highs.
3. Nasdaq is at 13 year highs — best close this week since 2000!
4. The Vix closed at its lowest levels since May 30, no fear in this market.
5. Regulators are pushing for big banks to have stricter capital rules.
6. AAII bears down to its lowest levels since Jan 2012 (but see below)
7. Hedge funds can now advertise, should make for some good fun.
8. Gold is on track for its largest weekly gain since October 2011, a reprieve for the beaten down gold bugs.
Negatives: 1. Economic bellwether UPS lowered its full-year guidance.
2. June PPI saw its biggest increase since September (0.8% v 0.5% expected)
3. Initial jobless claims jump to 360k v expectations of 340k
4. IMF growth forecast down for all 4 BRIC countries.
5. Global PC shipments fell 10.9% in Q2
6. China June exports fell 3.1% y/o/y, imports dropped 0.7%.
7. AAII bears down to its lowest levels since Jan 2012 (contrarian sell signal)
Special thanks, @michaelbatnick  |
| G20 Contribution to World Output (by Nation) Posted: 12 Jul 2013 11:30 AM PDT 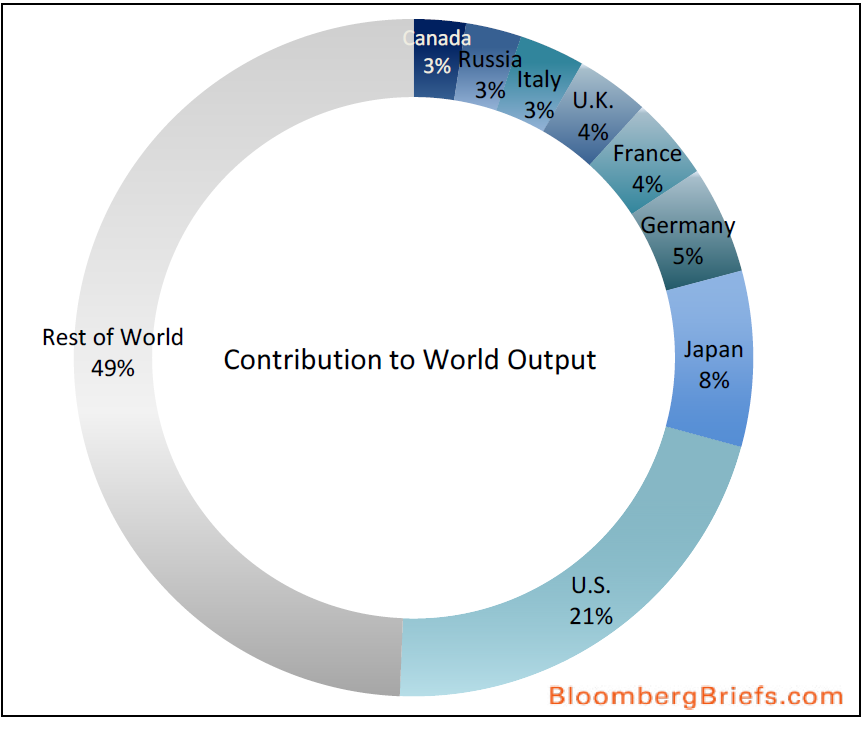
Source: Bloomberg
G-20 economies account for almost 90 percent of global output. The G-20 is meeting in Moscow today. The chart above shows the contributions to total global output from some of its members.  |
| NASDAQ 100 A-D line At New Highs Posted: 12 Jul 2013 09:00 AM PDT Click to enlarge
 Yesterday, I showed Merrill’s most active A/D line, which had broken out to new highs. One reader took exception with this, suggesting that its a case of bullish confirmation bias. I disagreed for 2 simple reasons: -Merrill’s "Chart Talk" has been running the most active A/D chart for years;
-Any index or major technical analytical measure making a new high is newsworthy
I appreciate the insidious nature of various biases in our wetware — and I want readers to keep pushing back on anything that remotely looks like bullish or bearish bias in action. Ironically, the day after that discussion, Merrill’s Technical Analysis group noted the break out in the A/D line of the Nasdaq 100 — itself at 13 year highs. To paraphrase Stephen Colbert, sometimes Reality just has a bullish bias . . . Text from Merrill’s wonks after the jump
The NASDAQ 100 A-D line is strong
The advance-decline line for the NASDAQ 100 (NDX) is strong with a break to new highs that preceded the new highs in the NDX. NASDAQ 100 breaks to 13-year highs
The NASDAQ 100 (NDX) is breaking to new 13-year highs and remains in a secular bull market with upside potential to 3265-3280 (pattern count and 61.8% retracement of the 2000 to 2002 decline). The rising channel from early 2009 provides additional resistance near 3500. Key support is 2875-2800 and has held. The NDX has decoupled from Apple (AAPL), which has had a much weaker trend and at 11.25% of the NDX, AAPL remains the heaviest weighted stock in the index. The advance-decline line for the NDX is strong with a break to new highs that preceded the new highs in the NDX (side bar).
Source:
NASDAQ indices break to new 13-year highs
Stephen Suttmeier and Jue Xiong
Merrill Lynch, July 12, 2013
Technical Analysis
Market Analysis | United States  |
| 10 Friday AM Reads Posted: 12 Jul 2013 06:45 AM PDT My morning reads: • The odds of who will be Next Chairperson of the US Federal Reserve (Paddy Power) see also Jon Hilsenrath Is Not Who You Think He Is (Business Insider)
• Bond Investors Can Run, but They Can't Hide (Moneybeat)
• The rich blow their money on hedge funds, instead of lottery tickets (The Atlantic) see also Hedge Funds Are for Suckers (Businessweek)
• In Defense of Concentrated Portfolios (Aleph Blog)
• Why John Maynard Keynes Supported the New Deal (Echoes)
• Bruising Quarter for Bond Fund Managers (WSJ) but see Stocks Embark on a Summer of Love (WSJ)
• SEC Lifts Ban on Hedge Fund Advertising. Hilarity Ensues (Businessweek)
• How to Profit from the Shiller Cape Ratio (A Dash of Insight) see also Big Names, Big Market Calls (A Dash of Insight)
• The Dropbox Opportunity (Stratechery)
What are you reading? Price discounts the news
Source: Charts etc.  |
| The Return of Glass Steagall ? Posted: 12 Jul 2013 04:00 AM PDT Senators Elizabeth Warren and John McCain are introducing new legislation to “take the financial industry back to an era when there was a strict divide between traditional banking and speculative activities.” I have a quote in the column: “The act also kept banks that use federal deposit insurance out of potentially volatile Wall Street activities, like trading. As a result, problems at investment banks were less likely to infect regulated banks. Losses at the Wall Street operations of Citigroup and Bank of America weighed heavily on those banks during the 2008 crisis. "For about 70 years, Glass-Steagall managed to keep the riskier, more damaging part of Wall Street away from what should be the boring, straightforward side of finance," Barry L. Ritholtz, chief executive of FusionIQ, an asset management and research firm, said. "It was the height of stupidity repealing Glass-Steagall."
The argument I made is summed up in this one paragraph: “During the era of Glass-Steagall, there were no systemic banking crises like the one that occurred in 2008. The restrictions the bill put on the financial sector did not seem to do much wider harm. According to analysis of government gross domestic product statistics, the American economy grew an average of 4 percent a year from 1933 until 1999, when Glass-Steagall was in effect. Even some who championed repealing the act, like the former Citigroup chairman Sanford I. Weill, have since called for the breakup of the bank behemoths.”
As a more recent example, the 1987 crash never spilled over into the banking system. We had Glass Steagall to thank for that firebreak. Source:
Senators Introduce Bill to Separate Trading Activities From Big Banks
PETER EAVIS
NYT, July 11, 2013
http://dealbook.nytimes.com/2013/07/11/senators-introduce-bill-to-separate-trading-activities-from-big-banks/  |
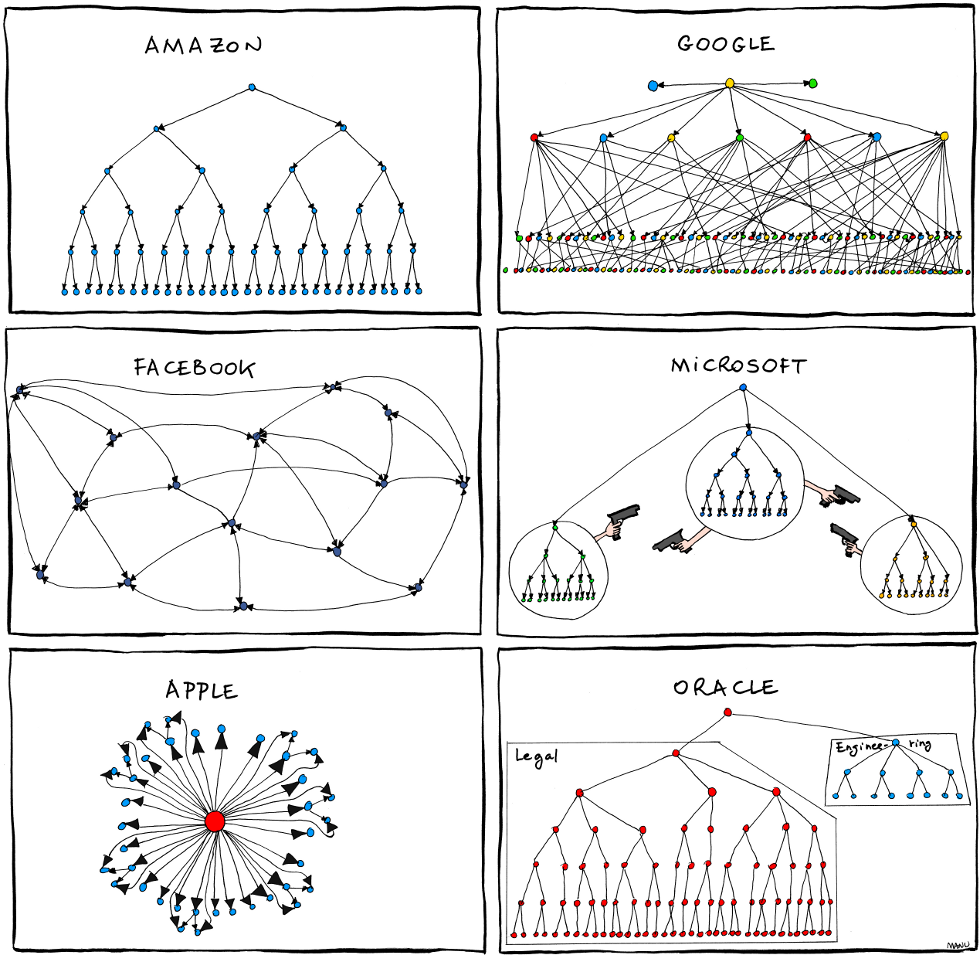
| Organizational Charts of Amazon, Apple, Facebook, Google Posted: 12 Jul 2013 03:15 AM PDT |


0 comments:
Post a Comment