


The Big Picture |
- Why Do Measures of Inflation Disagree?
- Succinct Summation of Week’s Events (12/13/13)
- Comedians in Cars Getting Coffee
- Josh Brown: Investment Fads and Themes
- More American Households Rely on Government Benefits
- 10 Friday Reads
- What Kinds of Errors Are You Making (and what are you doing to fix them?)
- 1967 Toyota 2000GT
- The Copenhagen Wheel
| Why Do Measures of Inflation Disagree? Posted: 14 Dec 2013 02:00 AM PST Why Do Measures of Inflation Disagree?
Inflation as measured by the personal consumption expenditures price index is near historical low levels, below the Federal Reserve's 2% longer-run goal. Another common inflation measure, the consumer price index, is also historically low, but remains closer to 2%. The recent gap between these two measures is due largely to the cost of shelter, which makes up a larger proportion of the CPI consumption basket. Based on history, the gap between the two inflation measures should close at a rate of 0.05 percentage point per month. In January 2012, the Federal Reserve's policymaking body, the Federal Open Market Committee (FOMC), announced it judged "that inflation at the rate of 2%, as measured by the annual change in the price index for personal consumption expenditures (PCEPI), is most consistent over the longer run with the Federal Reserve's statutory mandate" (Board of Governors 2012). The consumer price index (CPI) is an alternative inflation measure with a longer history. Like the PCEPI, the CPI is closely monitored by the FOMC and numerous private-sector firms and government agencies to track price movements. These two inflation measures tend to move closely together, though the CPI has tended to increase a bit faster in the past. Currently, annual CPI inflation excluding volatile food and energy prices is 0.5 percentage point higher than the comparable PCEPI core inflation measure. This Economic Letter examines the principal differences between the PCEPI and the CPI, and why their rates of inflation do not always align with one another. Their recent divergence can be explained largely by differences in how each measure accounts for consumer shelter costs. However, historical data imply that the two inflation measures should close much of this gap. Furthermore, when CPI inflation exceeds PCEPI inflation, it tends to slow towards the latter to close the gap. A tale of two measures The Bureau of Labor Statistics (BLS) first developed the CPI in 1913. The index is based on reports from retailers and tracks the price level for a basket of goods and services purchased by a typical urban consumer. The PCEPI is produced by the U.S. Commerce Department's Bureau of Economic Analysis (BEA) based on the same national accounts data used to estimate gross domestic product. For most of its history, the Federal Reserve used the CPI to set policy and forecast inflation. However, in February 2000, the FOMC began using the PCEPI to frame its inflation forecasts. The PCEPI and CPI share many of the same features. For example, the PCEPI, like the CPI, is designed to track the prices of goods and services consumed by households, and it includes much of the same data. However, the PCEPI differs from the CPI on many dimensions. The FOMC cited three of these as reasons for switching its focus from the CPI to the PCEPI (Board of Governors 2000). First, the PCEPI's formula adjusts to changing consumption patterns, while the CPI is based on a basket of goods and services that is largely fixed. Second, the PCEPI is revised over time, allowing for inflation to be tracked as a more consistent series. Third, the PCEPI's larger scope of goods and services provides a more comprehensive picture of the nation's consumer spending than the CPI. Figure 1
Figure 1 shows the year-over-year change in core CPI and PCEPI inflation over the past 10 years. These core measures exclude food and energy prices, reducing volatile short-run movements in the indexes. Core measures are better able to capture the underlying longer-term trends in inflation. The figure shows that core CPI and core PCEPI inflation measures are highly correlated, but that gaps frequently arise between them. Since August 2011, annual core CPI inflation has outpaced annual core PCEPI inflation by a minimum of 0.20 percentage point and an average of 0.34 percentage point. This is the longest sustained gap between these measures in the past 10 years. What explains the gap between CPI and PCEPI inflation? There are many reasons for the discrepancy between the CPI and PCEPI, but the differences can be summarized into questions of scope and weight. Differences in scope refer to goods and services included in one index basket but not the other. For example, in addition to direct spending by consumers, the PCEPI includes purchases by nonprofit organizations and those made on behalf of consumers by employers. By contrast, the CPI includes only direct, out-of-pocket consumer expenditures. The PCEPI also fluctuates differently than the CPI because of variances in the weight of specific goods and services in each consumption basket. In other words, specific goods and services may make up different proportions of each basket. This weighting is meant to capture the consumption habits of individual households and determines the importance of a specific good or service in the index. For example, because the CPI only measures out-of-pocket consumer expenditures, it places a lower weight on health expenditures, which are often partially paid for by employers. Two primary reasons explain why weights differ in the CPI and PCEPI: first, how often the weights are updated; second, the relative size of the weights in each basket. The CPI updates weights every two years, while the PCEPI updates them quarterly. The BLS method for the CPI is called a "fixed basket" approach, while the BEA method for the PCEPI is known as a "chained" approach. Broadly, this means that the CPI assumes that consumers change their purchasing habits every two years, while the PCEPI assumes that consumption habits change quarterly. Since 2000, the BLS has also produced a chained CPI to address this issue. The discrepancy in using a fixed versus a chained basket is actually small. The BEA estimates that since 2011 this difference has generated an average variation of only 0.14 percentage point between annualized CPI and PCEPI inflation. By contrast, the difference in the size and distribution of the weights in the indexes has a more significant impact on the gap. The BEA judges that since 2011 the difference in weights caused on average a 0.56 percentage point difference between CPI and PCEPI inflation (CPS 2012 and BLS 2012). To put this in perspective, the average difference between overall CPI and overall PCEPI inflation over this period was 0.58 percentage point. One way to see how the difference in the weights has affected the gap between CPI and PCEPI inflation is by looking at shelter prices. Importantly, neither index uses actual house prices to determine owner-occupied shelter prices. Rather, these prices are based on the BLS's Consumer Expenditure Survey, which asks households how much their homes would cost to rent on the open market. Shelter currently takes up 32% of the CPI consumption basket, but only 15% of the PCEPI basket. This difference reflects the larger scope of goods in the PCEPI, which dilutes the weight of shelter in its consumption basket. Overall, the CPI's larger weight on shelter means that it is more sensitive to shelter price movements than the PCEPI. The BEA estimates that, since 2011, the difference in these shelter weights has caused a 0.31 percentage point difference between CPI and PCEPI inflation. This accounts for more than half of the 0.56 percentage point weight-based effect over the recent period. Figure 2
Figure 3
Figure 2 illustrates the role of shelter prices in the overall inflation gap between the two indexes. The horizontal axis measures the gap in percentage between CPI shelter price inflation and core PCEPI inflation, based on 12-month changes. The vertical axis measures the gap between core CPI and core PCEPI inflation. The upward-sloping line shows a positive relationship between the two gap measures. The slope is approximately 0.5, indicating that, on average, when shelter price growth exceeds core PCEPI inflation by 1 percentage point, CPI inflation exceeds core PCEPI inflation by 0.5 percentage point. Figure 3 compares recent shelter price inflation with the gap between annual core CPI inflation and core PCEPI inflation. The inflation gap falls and then rises in tandem with shelter price inflation. Thus, the recent steady increase in shelter prices relative to other prices is a major factor driving the sustained increase in CPI inflation relative to PCEPI inflation. How does the gap usually close? Given that gaps between these inflation measures widen and narrow over time, we can assess how the gap has closed on average historically. To do this, we construct an error-correction model to answer two questions. First, if CPI inflation and PCEPI inflation are different, do they typically converge at some point? Second, which of these two inflation measures typically moves most to close the gap? We estimate that on average, when the two measures have diverged in the past, core CPI inflation has generally moved more to close the gap. This convergence is generally quite slow. For every 1 percentage point gap between the two measures, core CPI inflation typically moves 0.05 percentage point per month towards core PCE inflation. This suggests the current 0.5 percentage point gap will probably disappear in approximately 10 months. Conclusion Core CPI inflation is currently 0.5 percentage point higher than core PCEPI inflation. Historically, gaps of this size are not unusual and have primarily been driven by the differences of the weights the two indexes put on various items in their consumption baskets. For the most recent gap, the CPI's larger weight on shelter is a major reason why that index has exceeded PCEPI inflation. Based on historical patterns, we expect core CPI inflation to move back gradually toward PCEPI inflation. Yifan Cao is a research associate in the Economic Research Department of the Federal Reserve Bank of San Francisco. Adam Hale Shapiro is a senior economist in the Economic Research Department of the Federal Reserve Bank of San Francisco. References Board of Governors of the Federal Reserve System. 2000. "Monetary Policy Report to the Congress (Humphrey-Hawkins Report)," February 17. Board of Governors of the Federal Reserve System. 2012. "Longer-Run Goals and Policy Strategy." Press release, Federal Open Market Committee, January 25. |
| Succinct Summation of Week’s Events (12/13/13) Posted: 13 Dec 2013 12:30 PM PST Succinct Summation of Week's Events: Positives:
Negatives:
~~~
Peter Boockvar
|
| Comedians in Cars Getting Coffee Posted: 13 Dec 2013 11:30 AM PST Is that Howard I hear . . . ?
Source: |
| Josh Brown: Investment Fads and Themes Posted: 13 Dec 2013 10:30 AM PST
Every year, my colleague Josh Brown puts out a collection of “Investment Fads and Themes.” This year is no different. His half dozen themes for 2013 (in no particular order) are Elon Musk Stocks, Smart Beta, Long Nikkei/Short Yen, Bitcoin, Buybacks, and Carl Icahn: American Badass. Rather than try to explain any of these, I will instead suggest you check out the multicolored chart attached, then read Josh's full commentary here. Makes for good weekend reading!
Continues here |
| More American Households Rely on Government Benefits Posted: 13 Dec 2013 08:30 AM PST
|
| Posted: 13 Dec 2013 07:30 AM PST Happy end of the week. Some reads to get you ready for the weekend:
Continues here |
| What Kinds of Errors Are You Making (and what are you doing to fix them?) Posted: 13 Dec 2013 06:15 AM PST It is an annual event that comes with the regularity of Thanksgiving and holiday shopping. I am referring to the Black Friday survey that the National Retail Federation conducts every year, in their misguided attempt to forecast holiday sales. As we discussed a few weeks ago, the National Retail Federation Black Friday survey is nonsense. Money in the bank, a sure thing, a can't miss bet, it has been wildly wrong each and every year. Once again, in 2013, they did not disappoint. As the most recent data shows, they got it wrong. Again. And not only in magnitude, but in direction as well. The most charitable comment I can make is that they did not miss as wildly as they have in prior years. The mathematician in me wants to point out that the merely poor – as opposed to awful – results could have been the result of randomness. Given the NRF's past track record, even if they nailed to the second decimal place, I would be compelled to chalk it up to dumb luck. But this column is not about me beating my chest, telling you I was right. Hell, who really cares that the National Retail Federation got Black Friday wrong for the 10th consecutive year. For anyone on the opposite side of the trade with the NRF, that has become a given. Since its Friday, I'd rather wax philosophical about headspace and intellectual approach rather than focus on the details of any one monthly retail sales report. Let us discuss information sources, methodologies, and precisely the choices we choose to make when we select what to believe. This is a much more significant point than many investors and traders realize.
Continues here |
| Posted: 13 Dec 2013 03:00 AM PST My pal Jan has one of these for sale; Its a 100 point car, The Toyota 2000GT been called Japan's million-dollar E-type, going most recently for $1.2m. I think I can save you a few $100k on the car if anyone wants to buy one . . .
Source: RM Auctions |
| Posted: 13 Dec 2013 02:30 AM PST The Copenhagen wheel Technical specifications: Many of you ask about the Copenhagen wheel’s relation to the TV show Weeds. the answer is yes, Weeds used it in their show during a whole season, they were granted the permission to use it by its inventors at the MIT SENSEable City Lab. |
 Sources: Bureau of Economic Analysis, Bureau of Labor Statistics.
 Sources: Bureau of Economic Analysis, Bureau of Labor Statistics.
 Sources: Bureau of Economic Analysis, Bureau of Labor Statistics.
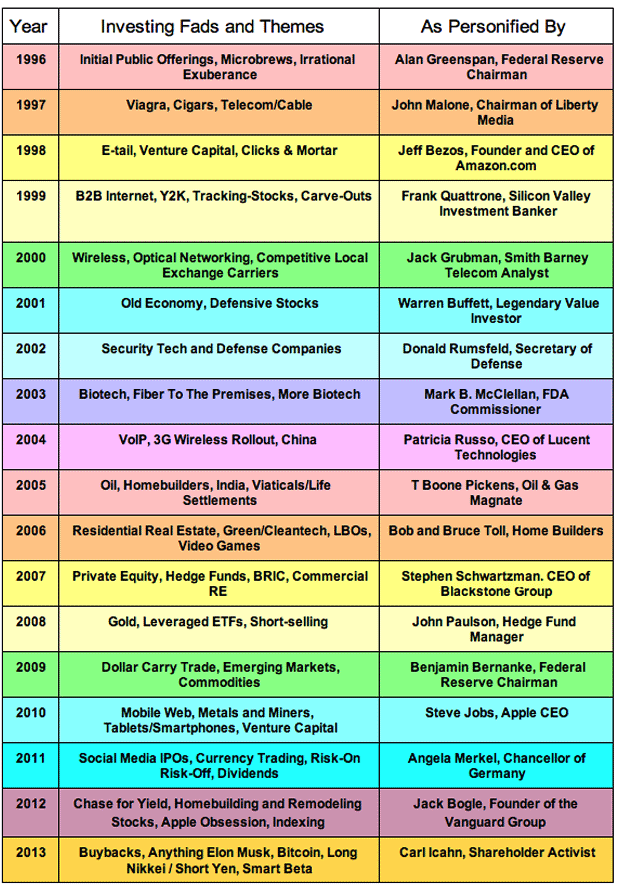


| You are subscribed to email updates from The Big Picture To stop receiving these emails, you may unsubscribe now. | Email delivery powered by Google |
| Google Inc., 20 West Kinzie, Chicago IL USA 60610 | |


0 comments:
Post a Comment